Lesson · Grade 10 · Workplace Mathematics
Reading an Infographic Critically
- Grade 10
- Workplace Mathematics
- 1 min 53 s
- British Columbia
- BC10-MA-46
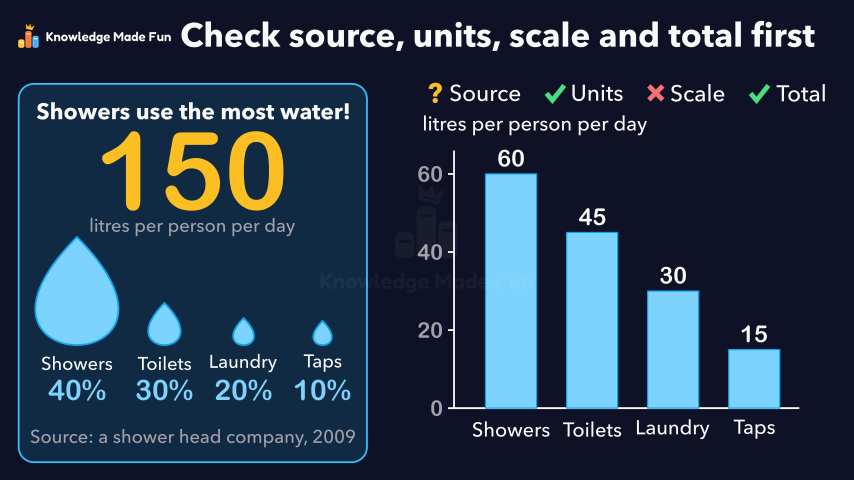
A made-up water-use poster with a big, bold "150 litres per person per day" is put through four checks: the source and date (a shower head company in 2009, so be cautious), the units (clear: a home of 4 people uses 4 × 150 = 600 litres a day), the scale (the shower drop is drawn 4 times as tall as laundry, but 40% is only 2 times 20%) and the total (40 + 30 + 20 + 10 = 100). The claim is then rebuilt as a plain bar graph in litres from 0 (60, 45, 30 and 15), which shows that showers use only 2 times as much as laundry, and the video ends with the four checks.
Anyone can watch two lessons on the website without an account. Signing in is free, no payment and no card, and opens three a day; Plus has no limit.
Loading
In one sentence
The question this lesson answers
An infographic uses pictures, numbers and words to make a point. Can we trust this made-up one?
A common mistake: trusting a number because it is big and bold.
Transcript
What the lesson says
An infographic uses pictures, numbers and words to make a point. Can we trust this made-up one?
A common mistake: trusting a number because it is big and bold.
To read it critically, check the source and date, units, scale and total.
First, the source and date, in the small print.
A shower head company may want showers to look big, and data from 2009 is old. Be cautious.
Next, the units: 150 litres per person per day.
That is clear: a home of 4 people uses 4 times 150, or 600 litres a day.
Third, the scale. Drawn to scale means sizes match the numbers.
The shower drop is as tall as 4 laundry drops: 1, 2, 3, 4.
But 40 percent is only 2 times 20 percent, so it is not to scale.
Last, the total. Parts of a whole should add to 100 percent, give or take rounding.
40 plus 30 plus 20 plus 10 is 100, so this check passes.
Now rebuild the claim as a plain bar graph in litres, starting at 0.
40 percent of 150 litres is 60 litres for showers.
In the same way, toilets get 45, laundry 30 and taps 15.
By its own numbers, showers use the most, but only 2 times laundry, not 4 times as drawn.
Before you trust a big, bold number, check its source, units, scale and total.
Curriculum
Where this fits
- British Columbia, Grade 10
Workplace Mathematics 10, Data and probability: create, interpret, and critique graphsBC10-MA-46
Previous: Misleading Graphs: Broken Axes and Stretched PicturesNext: Mean, Median and Mode of a Data Set
The outcomes and strands follow the British Columbia curriculum.
Keep going
 1 min 23 s
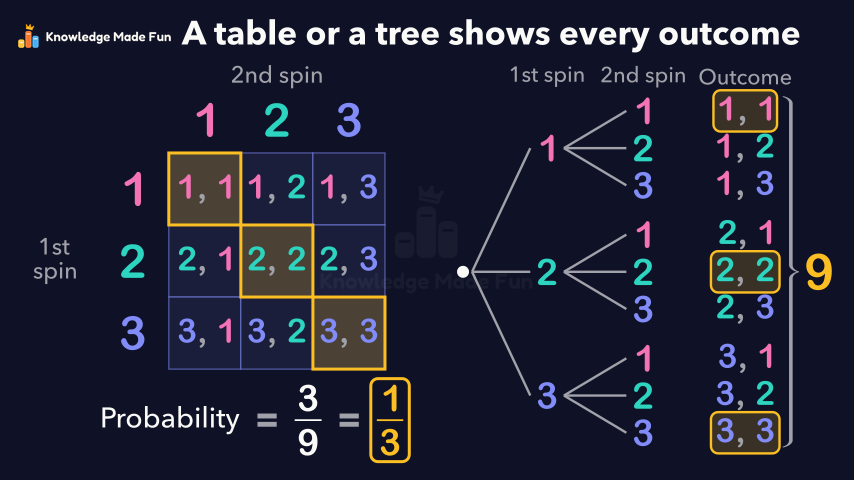
All the Outcomes of Two Spins: Tables and Tree Diagrams
Grade 7 · 1 min 23 s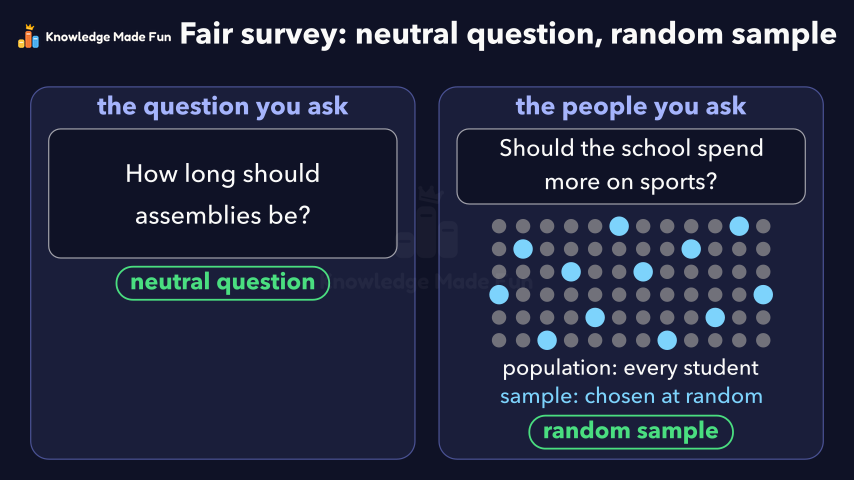 1 min 47 s
Bias in a Survey: Leading Questions and Unfair Samples
Grade 9 · 1 min 47 s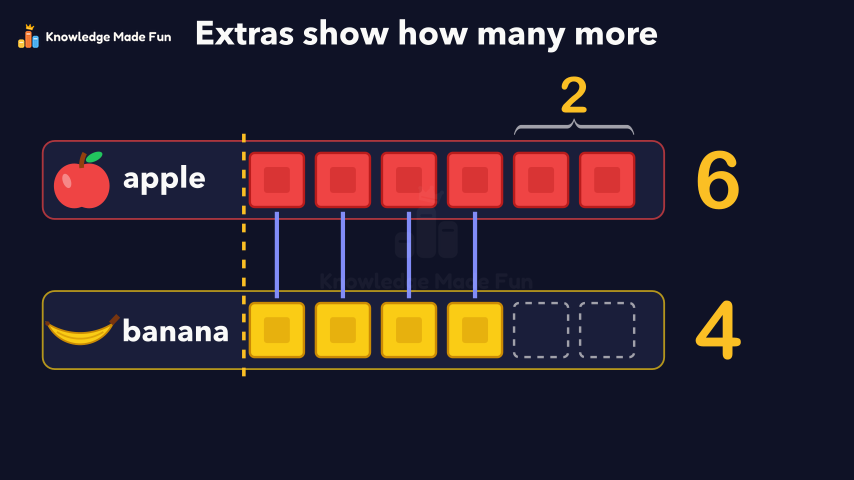 1 min
Block Graphs: Which Row Is Longer?
Grade 1 · 1 min 1 min 58 s
Choosing the best average: mean, median or mode
Grade 8 · 1 min 58 s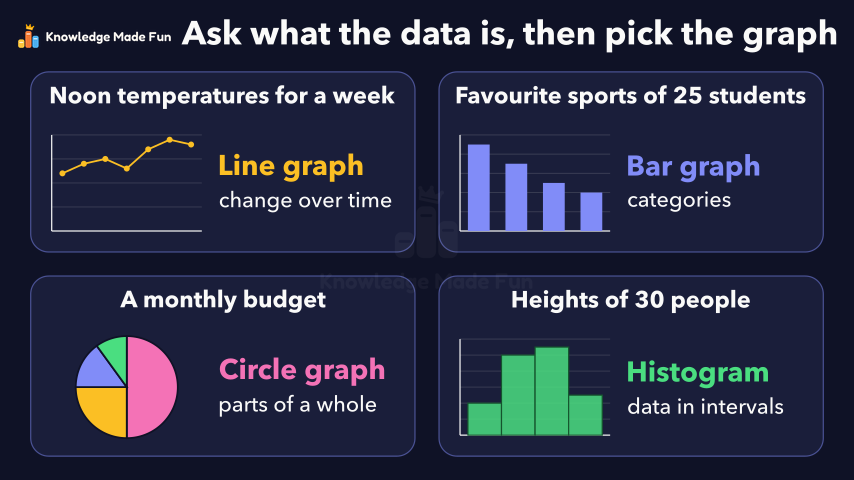 1 min 56 s
Choosing the right graph for the data
Grade 10 · 1 min 56 s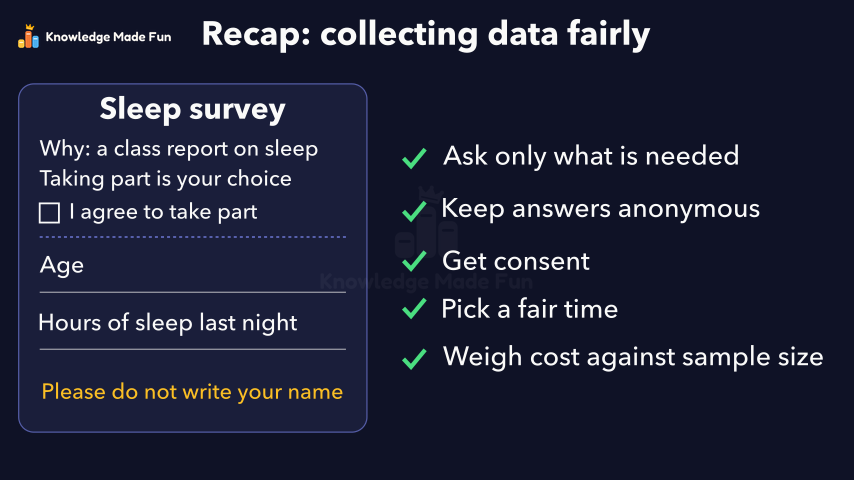 1 min 50 s
Collecting Data Fairly: Privacy, Consent, Timing and Cost
Grade 9 · 1 min 50 s 55 s
Could It Snow Tomorrow? Likely or Unlikely
Kindergarten · 55 s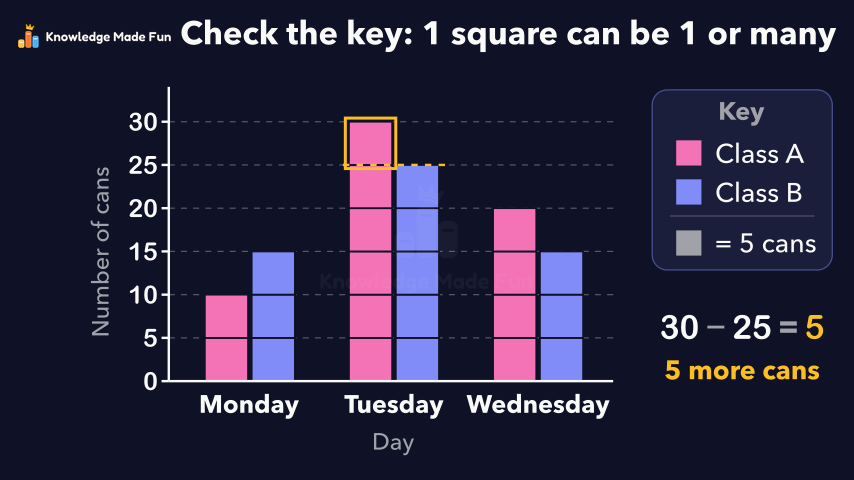 1 min 27 s
Double bar graphs with a scale
Grade 5 · 1 min 27 s
- All Grade 10 Workplace Mathematics lessons
- Create a free account to watch three lessons a day, no payment and no card.