Lesson · Grade 10 · Workplace Mathematics
Choosing the right graph for the data
- Grade 10
- Workplace Mathematics
- 1 min 56 s
- British Columbia
- BC10-MA-43
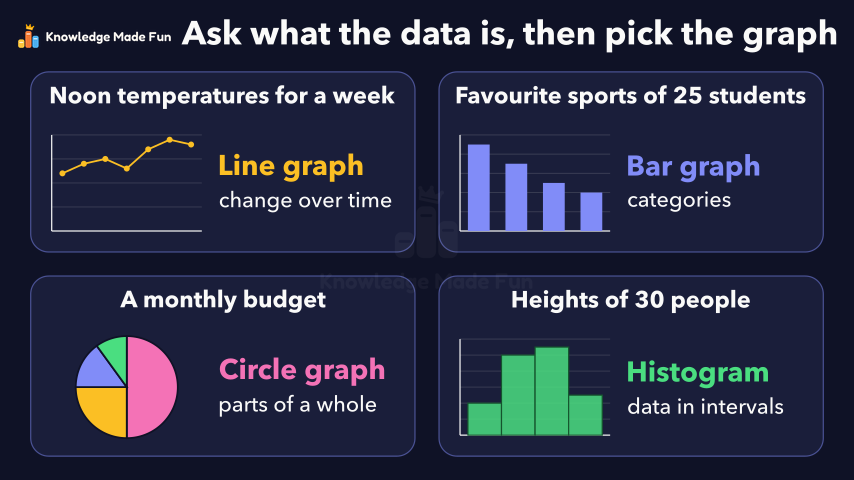
Four data sets are each matched with their graph: a week of noon temperatures with a line graph, favourite sports with a bar graph, a monthly budget with a circle graph and the heights of 30 people with a histogram. Along the way, two wrong matches show why the choice matters: a circle graph hides the rise in temperature, and a line drawn through sports that have no order seems to fall or rise depending only on how the bars are arranged.
Anyone can watch two lessons on the website without an account. Signing in is free, no payment and no card, and opens three a day; Plus has no limit.
Loading
In one sentence
The question this lesson answers
Here are four data sets. Which kind of graph fits each one?
First, the temperature at noon each day for one week.
Transcript
What the lesson says
Here are four data sets. Which kind of graph fits each one?
First, the temperature at noon each day for one week.
Change over time suits a line graph: points joined in day order show the trend, from 12 up to 19 degrees.
Now a wrong match. A circle graph, or pie chart, shows parts of one whole.
It fails: the total, 108 degrees, is not a whole of anything, and the slices hide the rise.
Next, 25 students chose a favourite sport. Each sport is a category: a group with no order.
To compare categories, use a bar graph: one bar per sport, with gaps between them.
A common mistake is a line graph. It suggests a fall from soccer to swimming.
But reorder the sports, and the same data seems to rise. The line means nothing here.
Third, a monthly budget: rent, food, transport and savings.
Parts of a whole suit a circle graph. The shares add to 100 per cent, and rent's 50 per cent fills half the circle.
Last, the heights of 30 people, in intervals: ranges 10 centimetres wide.
Data in intervals suits a histogram. Each bar's height is the frequency: the count in that interval.
The bars touch, as the intervals meet with no gaps. The counts add to 30.
Change over time, line graph. Categories, bar graph. Parts of a whole, circle graph. Data in intervals, histogram.
Ask what kind of data you have, then pick the graph made for it.
Curriculum
Where this fits
- British Columbia, Grade 10
Workplace Mathematics 10, Data and probability: create, interpret, and critique graphsBC10-MA-43
The outcomes and strands follow the British Columbia curriculum.
Keep going
 1 min 23 s
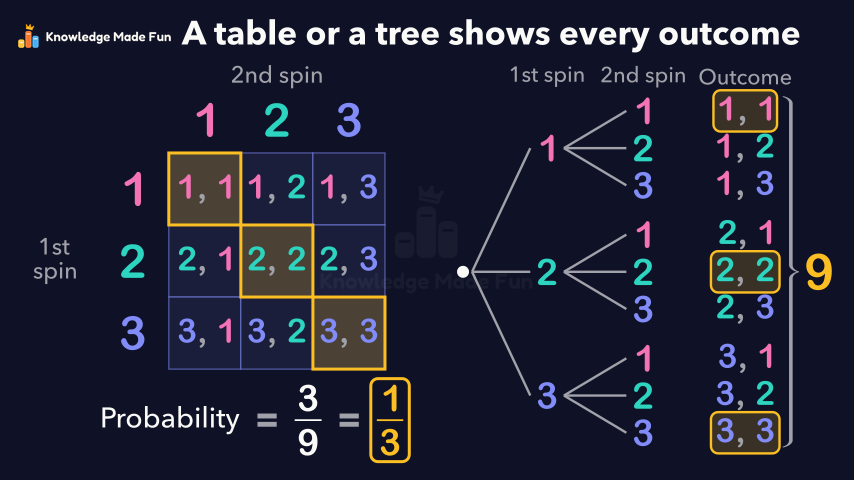
All the Outcomes of Two Spins: Tables and Tree Diagrams
Grade 7 · 1 min 23 s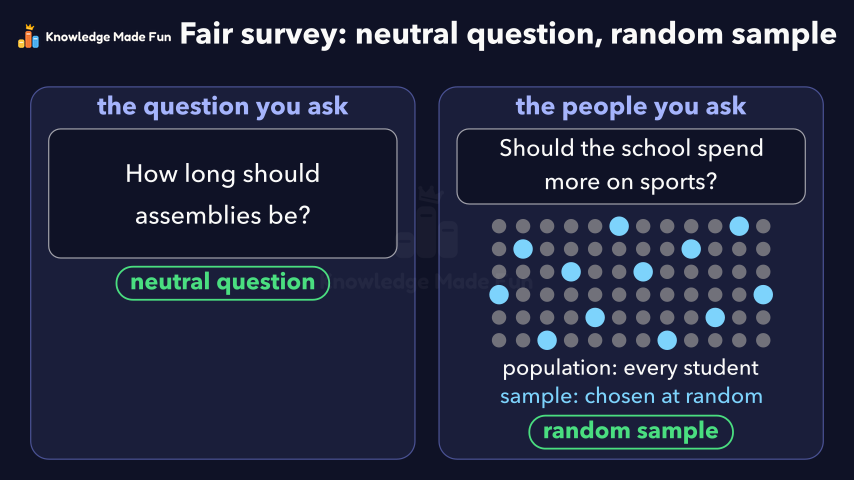 1 min 47 s
Bias in a Survey: Leading Questions and Unfair Samples
Grade 9 · 1 min 47 s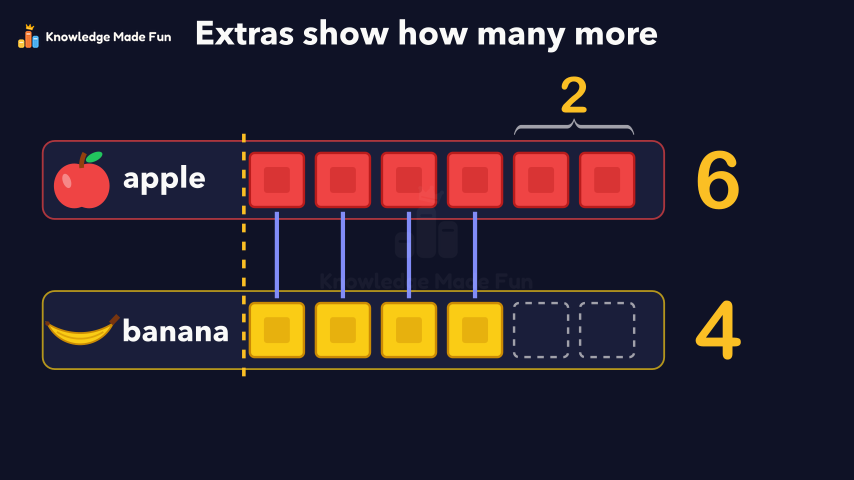 1 min
Block Graphs: Which Row Is Longer?
Grade 1 · 1 min 1 min 58 s
Choosing the best average: mean, median or mode
Grade 8 · 1 min 58 s 1 min 50 s
Collecting Data Fairly: Privacy, Consent, Timing and Cost
Grade 9 · 1 min 50 s 55 s
Could It Snow Tomorrow? Likely or Unlikely
Kindergarten · 55 s 1 min 27 s
Double bar graphs with a scale
Grade 5 · 1 min 27 s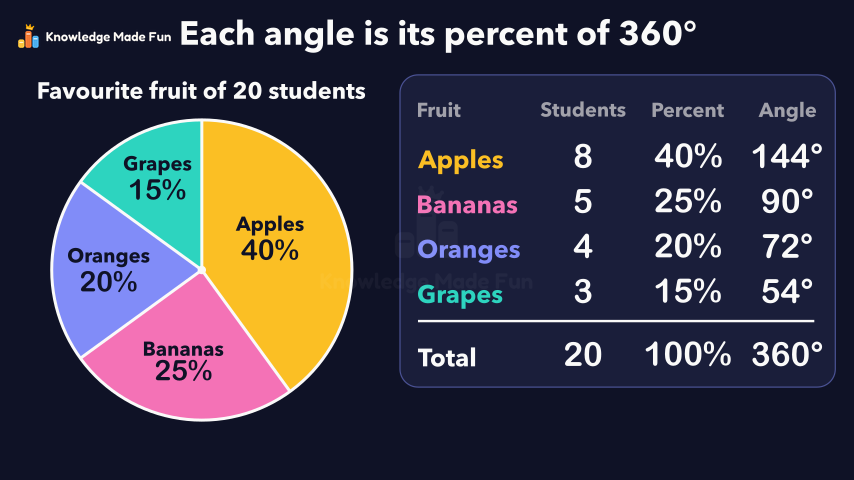 1 min 21 s
Drawing a circle graph from data
Grade 7 · 1 min 21 s
- All Grade 10 Workplace Mathematics lessons
- Create a free account to watch three lessons a day, no payment and no card.