Lesson · Grade 10 · Workplace Mathematics
Histograms: bars for ranges of numbers
- Grade 10
- Workplace Mathematics
- 2 min 8 s
- British Columbia
- BC10-MA-44
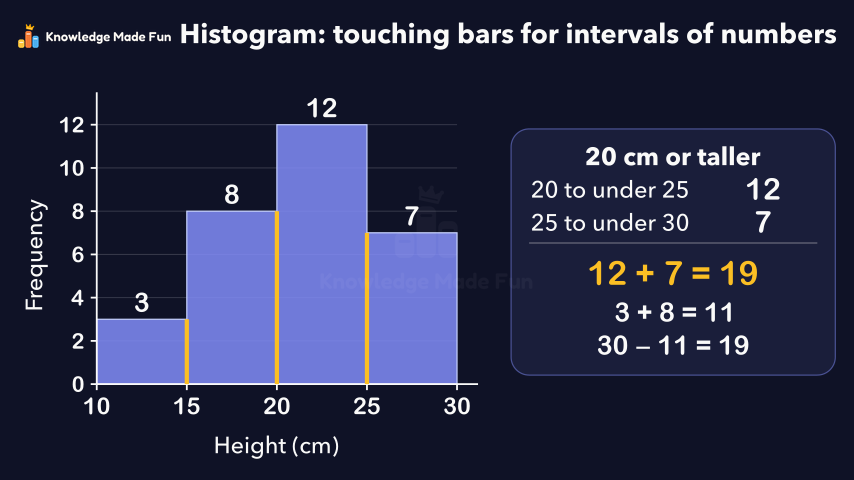
The heights of 30 plants are sorted into four 5 cm intervals, and the frequency table (3, 8, 12, 7, checked to total 30) is turned into a histogram whose bars touch, set against a bar graph of plant types whose bars have gaps. A plant of exactly 20 cm is placed in 20 to under 25 only, warning against counting a boundary value twice, and the bars from 20 cm up give 12 + 7 = 19 plants, checked as 30 − 11 = 19.
Anyone can watch two lessons on the website without an account. Signing in is free, no payment and no card, and opens three a day; Plus has no limit.
Loading
In one sentence
The question this lesson answers
We measured 30 plants in centimetres. How can we show their heights on one graph?
First, sort the heights into intervals. An interval is a range of numbers, like 10 to under 15.
Transcript
What the lesson says
We measured 30 plants in centimetres. How can we show their heights on one graph?
First, sort the heights into intervals. An interval is a range of numbers, like 10 to under 15.
The frequency is how many plants fall in each interval: 3, 8, 12 and 7.
Check: 3 plus 8 plus 12 plus 7 is 30, so every plant is counted.
A histogram is a graph of data in intervals. Height goes along the horizontal axis, frequency up the vertical axis.
Every interval is 5 centimetres wide, so each bar's height is its frequency: 3, 8, 12 and 7.
The bars touch, because the intervals run on with no gaps between them.
Sorted by type, the same plants make a bar graph. Bean, pea and tomato are separate categories, so its bars have gaps.
A plant exactly 20 centimetres tall sits on a boundary, where one interval ends and the next begins.
Under 20 means less than 20, so it is not in 15 to under 20. It goes in 20 to under 25.
Counting a boundary value in both intervals is a common mistake. Count it once.
Now, how many plants are 20 centimetres or taller?
Take every bar from 20 upward: 12 plants from 20 to under 25, and 7 from 25 to under 30.
12 plus 7 is 19, so 19 plants are 20 centimetres or taller.
Check: 3 plus 8 is 11 plants under 20, and 30 minus 11 is 19.
A histogram shows how many values fall in each interval, with bars that touch.
Curriculum
Where this fits
- British Columbia, Grade 10
Workplace Mathematics 10, Data and probability: create, interpret, and critique graphsBC10-MA-44
Previous: Choosing the right graph for the dataNext: Misleading Graphs: Broken Axes and Stretched Pictures
The outcomes and strands follow the British Columbia curriculum.
Keep going
 1 min 23 s
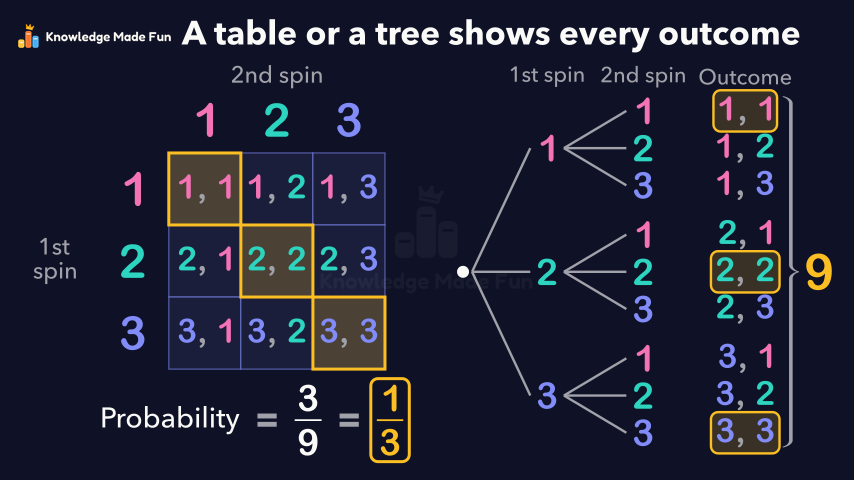
All the Outcomes of Two Spins: Tables and Tree Diagrams
Grade 7 · 1 min 23 s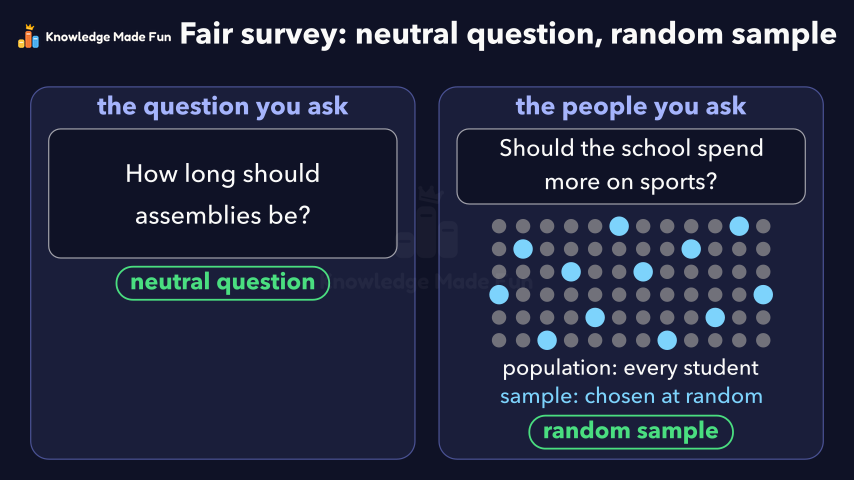 1 min 47 s
Bias in a Survey: Leading Questions and Unfair Samples
Grade 9 · 1 min 47 s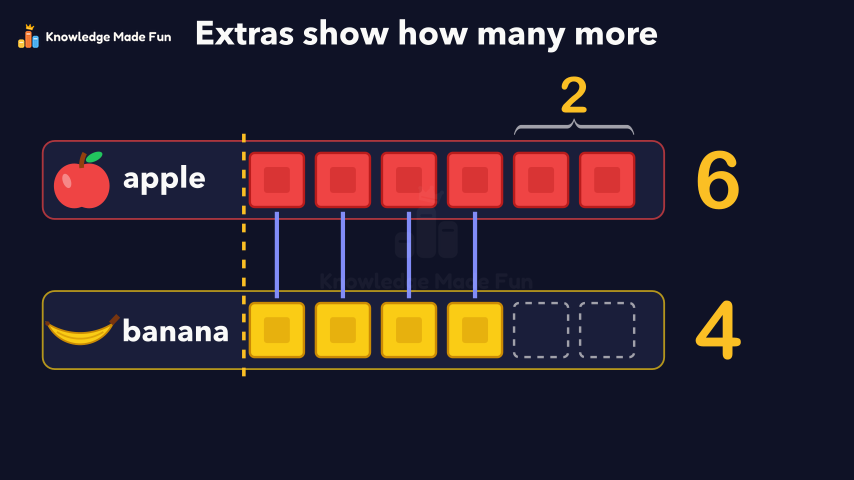 1 min
Block Graphs: Which Row Is Longer?
Grade 1 · 1 min 1 min 58 s
Choosing the best average: mean, median or mode
Grade 8 · 1 min 58 s 1 min 56 s
Choosing the right graph for the data
Grade 10 · 1 min 56 s 1 min 50 s
Collecting Data Fairly: Privacy, Consent, Timing and Cost
Grade 9 · 1 min 50 s 55 s
Could It Snow Tomorrow? Likely or Unlikely
Kindergarten · 55 s 1 min 27 s
Double bar graphs with a scale
Grade 5 · 1 min 27 s
- All Grade 10 Workplace Mathematics lessons
- Create a free account to watch three lessons a day, no payment and no card.