Lesson · Grade 7 · Mathematics
All the Outcomes of Two Spins: Tables and Tree Diagrams
- Grade 7
- Mathematics
- 1 min 23 s
- British Columbia
- BC7-MA-69
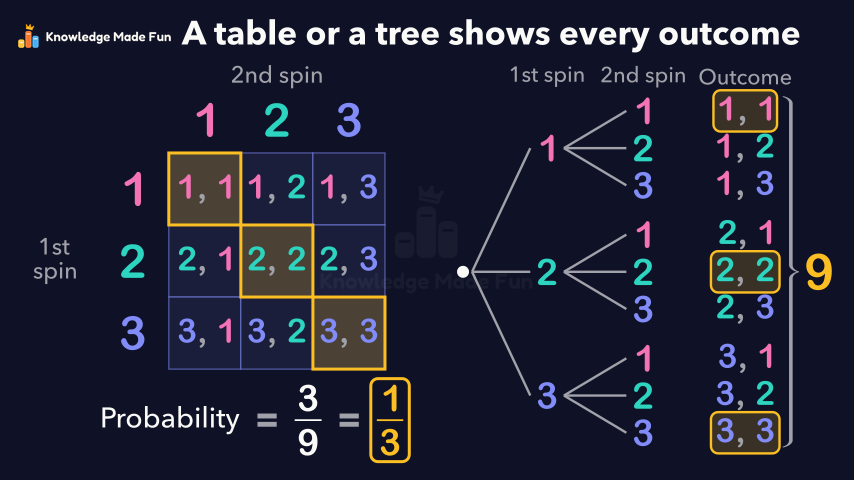
A spinner numbered 1, 2 and 3 is spun twice, and a table and a tree diagram each list all 3 × 3 = 9 possible outcomes, showing that 1 then 3 and 3 then 1 are different outcomes. Since 3 of the 9 equally likely outcomes have the same number twice, the probability of a match is 3/9, or one third.
Concept: All the outcomes of two events: tables and tree diagrams
Anyone can watch two lessons on the website without an account. Signing in is free, no payment and no card, and opens three a day; Plus has no limit.
Loading
In one sentence
The question this lesson answers
If we spin this spinner twice, how likely is the same number both times?
The spinner has 3 equal parts, numbered 1, 2 and 3.
Transcript
What the lesson says
If we spin this spinner twice, how likely is the same number both times?
The spinner has 3 equal parts, numbered 1, 2 and 3.
One outcome is a 1 on the first spin, then a 3 on the second.
To list every outcome, put the first spin down the side and the second across the top.
Each box is one outcome, like 1 then 3.
3 rows of 3 boxes make 9 outcomes.
A tree diagram shows the same outcomes, starting with 3 branches for the first spin.
Each of those splits into 3 more branches for the second spin.
Each path from left to right is one outcome, like 1 then 3.
There are 9 paths, so 9 outcomes, just like the table.
1 then 3 and 3 then 1 are different outcomes, so we count both.
All 9 outcomes are equally likely, and 3 of them have the same number twice.
So the probability of the same number twice is 3 out of 9, or one third.
A table or a tree diagram shows every outcome of two events.
Curriculum
Where this fits
- British Columbia, Grade 7
Mathematics, Data and probability: experimental probability with two independent eventsBC7-MA-69
Previous: What Independent Events AreNext: Experimental probability from a set of trials
- British Columbia, Grade 8
Mathematics, Data and probability: theoretical probability with two independent eventsBC8-MA-40
Previous: Choosing the best average: mean, median or modeNext: Two independent events: multiply the probabilities
This lesson is also listed in Grade 8.
The outcomes and strands follow the British Columbia curriculum.
Keep going
 1 min 47 s
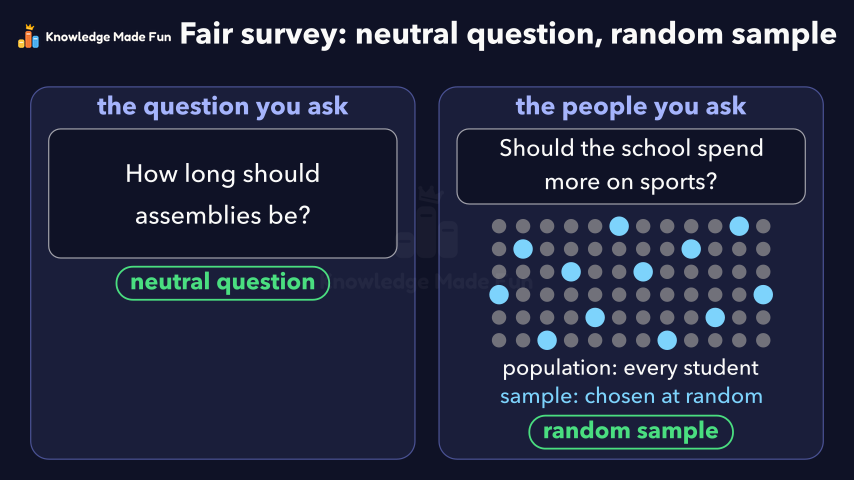
Bias in a Survey: Leading Questions and Unfair Samples
Grade 9 · 1 min 47 s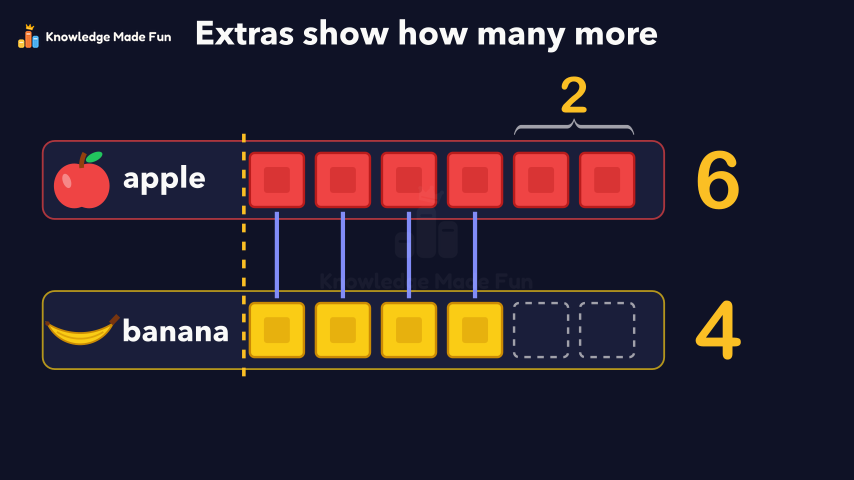 1 min
Block Graphs: Which Row Is Longer?
Grade 1 · 1 min 1 min 58 s
Choosing the best average: mean, median or mode
Grade 8 · 1 min 58 s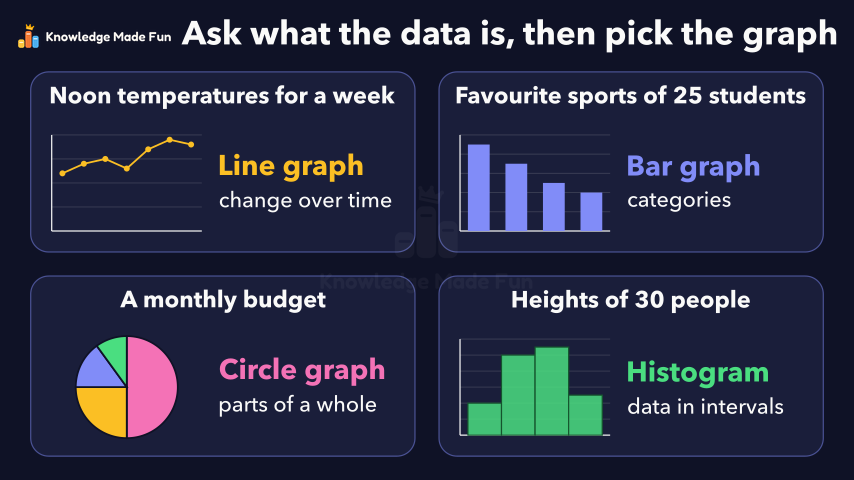 1 min 56 s
Choosing the right graph for the data
Grade 10 · 1 min 56 s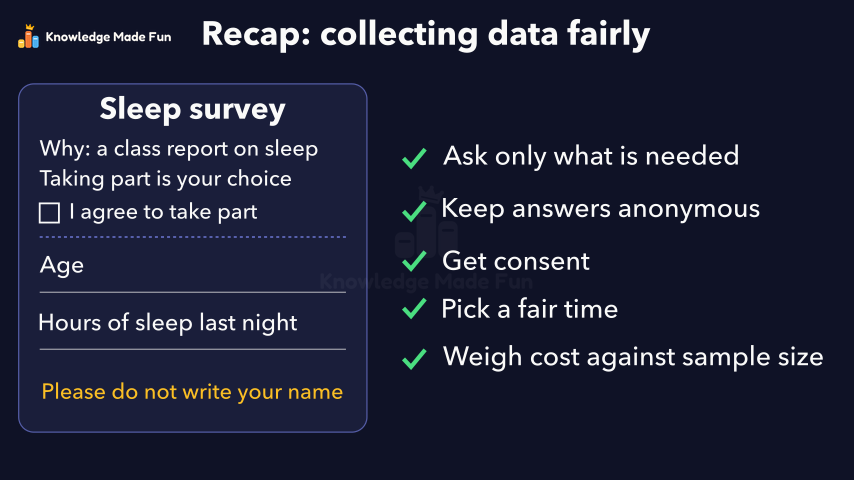 1 min 50 s
Collecting Data Fairly: Privacy, Consent, Timing and Cost
Grade 9 · 1 min 50 s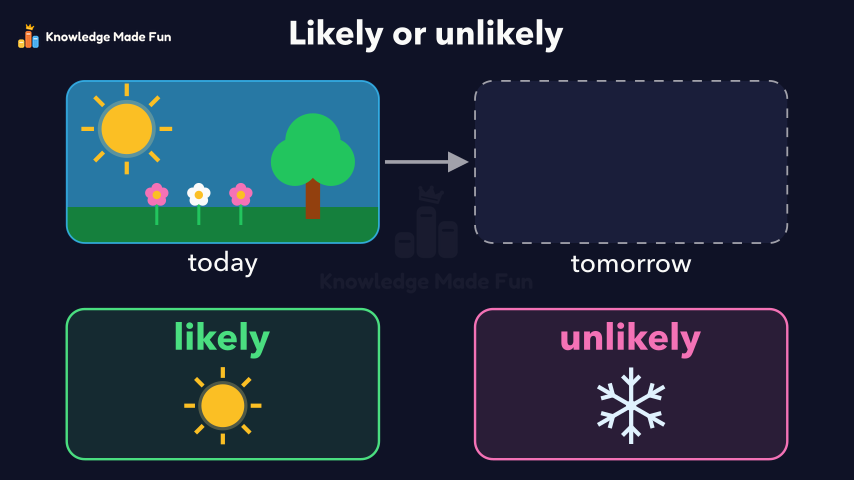 55 s
Could It Snow Tomorrow? Likely or Unlikely
Kindergarten · 55 s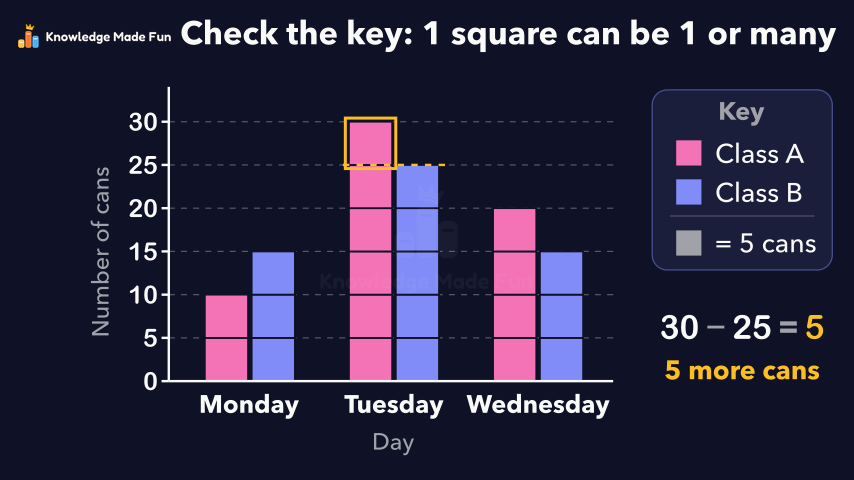 1 min 27 s
Double bar graphs with a scale
Grade 5 · 1 min 27 s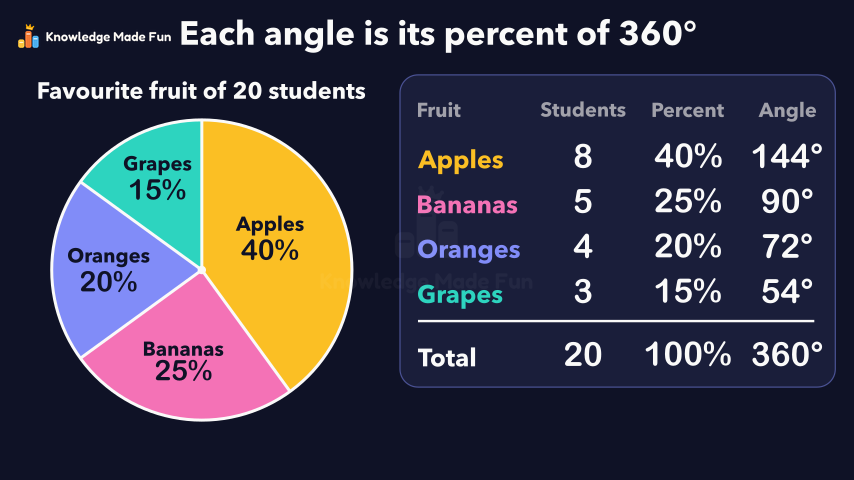 1 min 21 s
Drawing a circle graph from data
Grade 7 · 1 min 21 s
- All Grade 7 Mathematics lessons
- Teachers: the maths worksheets for Grade 7 are in the dashboard, each with a worked example and a proven answer key.
- Try the graph paper, free for everyone, no account needed.
- Create a free account to watch three lessons a day, no payment and no card.