Lesson · Grade 9 · Mathematics
Bias in a Survey: Leading Questions and Unfair Samples
- Grade 9
- Mathematics
- 1 min 47 s
- British Columbia
- BC9-MA-28
The leading question "Do you agree that the long, boring assembly should be shorter?" pushes a yes. Asking 20 students (16 ÷ 20 = 80%) and then 200 (160 ÷ 200 = 80%) shows that more answers do not remove the bias, and a neutral question fixes it. In a second survey, asking only the basketball team about sports money shows sampling bias, and the video ends on the recap: a fair survey asks a neutral question to a random sample.
Anyone can watch two lessons on the website without an account. Signing in is free, no payment and no card, and opens three a day; Plus has no limit.
Loading
In one sentence
The question this lesson answers
A survey asks people questions to learn what a group thinks. It is biased if the way it is run pushes the results one way.
Bias can hide in two places: the question you ask, and the people you ask.
Transcript
What the lesson says
A survey asks people questions to learn what a group thinks. It is biased if the way it is run pushes the results one way.
Bias can hide in two places: the question you ask, and the people you ask.
Here is a question: do you agree that the long, boring assembly should be shorter?
Long and boring tell you what to think, and do you agree invites a yes.
A question that pushes toward one answer is called a leading question.
Does asking more people fix it? Suppose 16 of 20 students say yes. 16 divided by 20 is 80 percent.
Ask 200 students the same question: if 160 say yes, 160 divided by 200 is still 80 percent.
Ten times the answers, the same push. More answers do not fix a leading question.
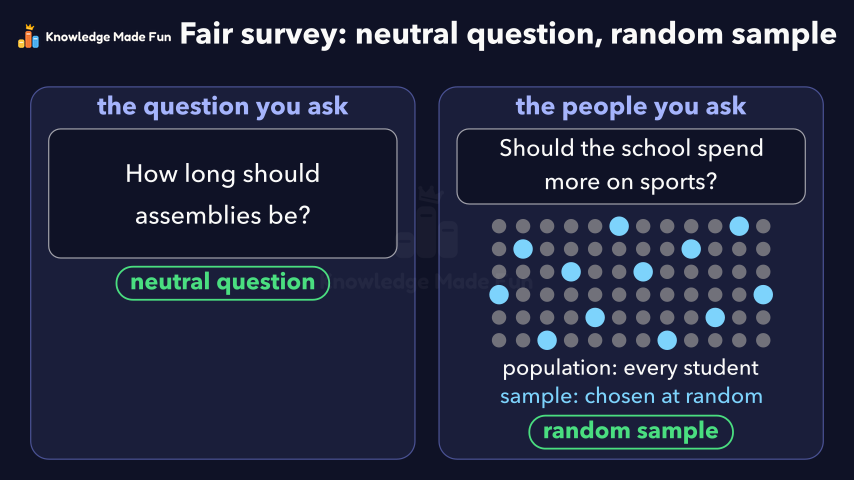
The fix is a neutral question that hints at no answer: how long should assemblies be?
A second survey asks: should the school spend more on sports?
The population is the whole group you want to learn about: every student in the school.
The sample is the people you actually ask: here, only the basketball team.
Players are more likely to want sports money, so the sample favours one group. This is sampling bias.
The fix is a random sample: every student has the same chance of being picked.
A fair survey asks a neutral question to a random sample.
Curriculum
Where this fits
- British Columbia, Grade 9
Mathematics, Data and probability: statistics in societyBC9-MA-28
Previous: Ways to Choose a Sample, and Which Ones Are FairNext: Misleading Graphs: Broken Axes and Stretched Pictures
The outcomes and strands follow the British Columbia curriculum.
Keep going
 1 min 23 s
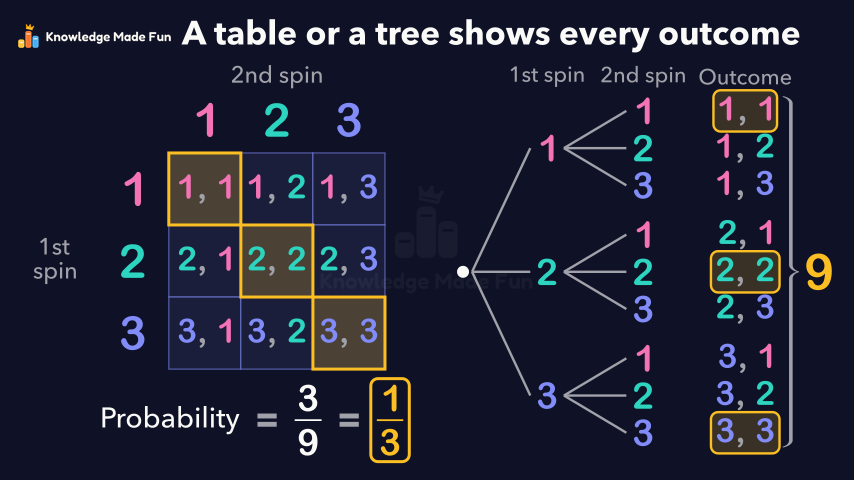
All the Outcomes of Two Spins: Tables and Tree Diagrams
Grade 7 · 1 min 23 s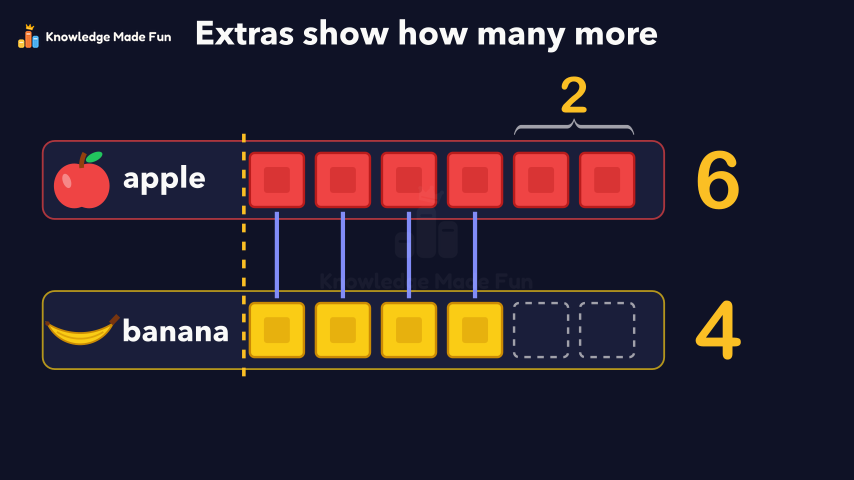 1 min
Block Graphs: Which Row Is Longer?
Grade 1 · 1 min 1 min 58 s
Choosing the best average: mean, median or mode
Grade 8 · 1 min 58 s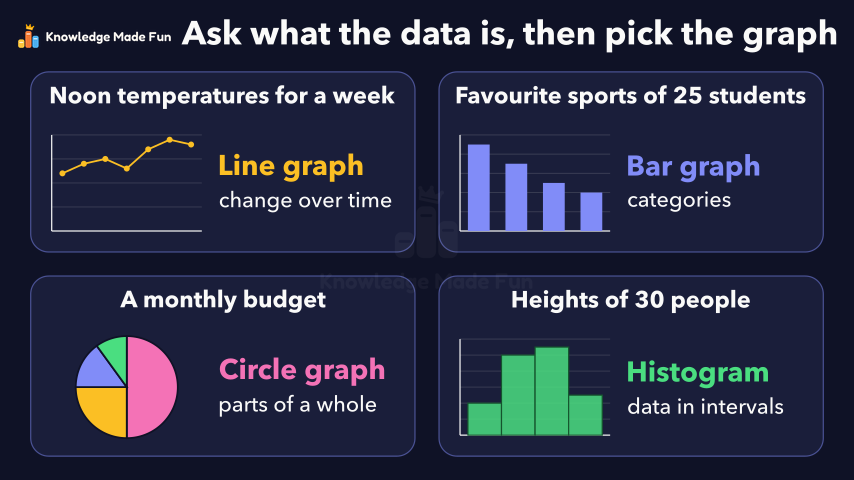 1 min 56 s
Choosing the right graph for the data
Grade 10 · 1 min 56 s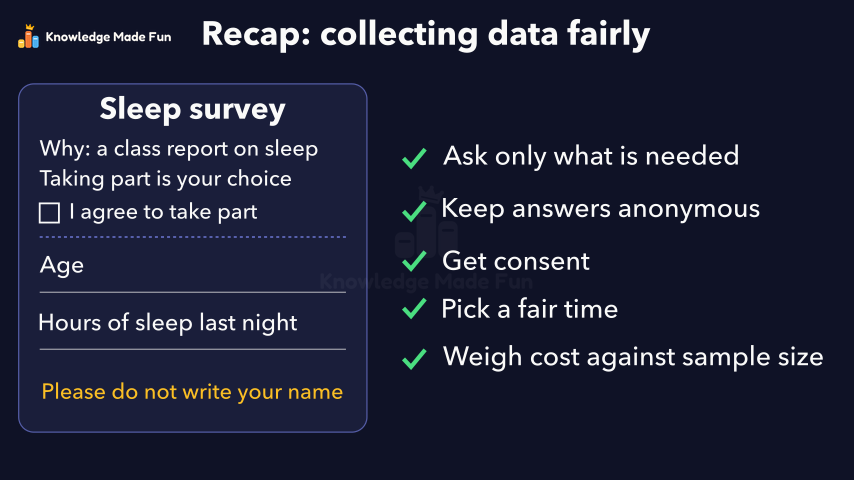 1 min 50 s
Collecting Data Fairly: Privacy, Consent, Timing and Cost
Grade 9 · 1 min 50 s 55 s
Could It Snow Tomorrow? Likely or Unlikely
Kindergarten · 55 s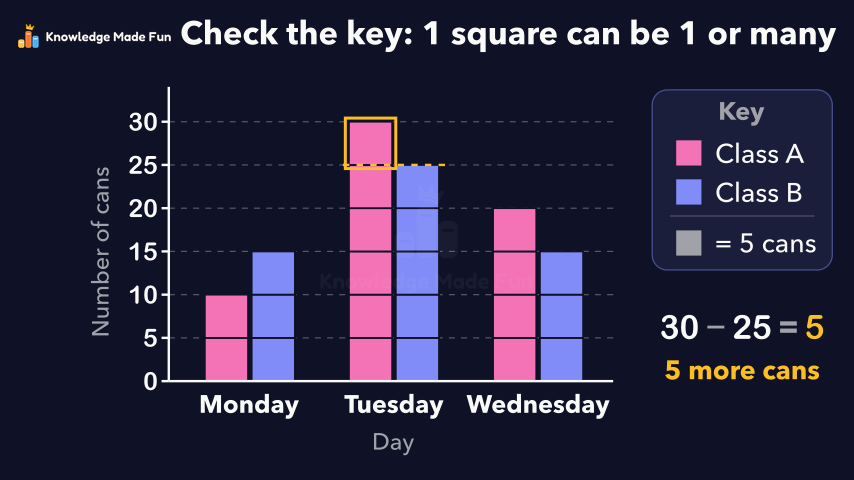 1 min 27 s
Double bar graphs with a scale
Grade 5 · 1 min 27 s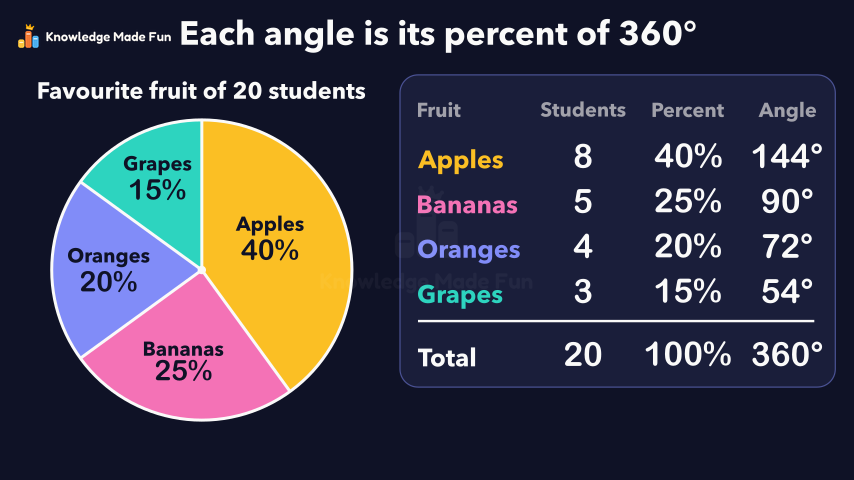 1 min 21 s
Drawing a circle graph from data
Grade 7 · 1 min 21 s
- All Grade 9 Mathematics lessons
- Try the graph paper, free for everyone, no account needed.
- Create a free account to watch three lessons a day, no payment and no card.