Lesson · Grade 9 · Mathematics
Misleading Graphs: Broken Axes and Stretched Pictures
- Grade 9
- Mathematics
- 1 min 59 s
- British Columbia
- BC9-MA-29
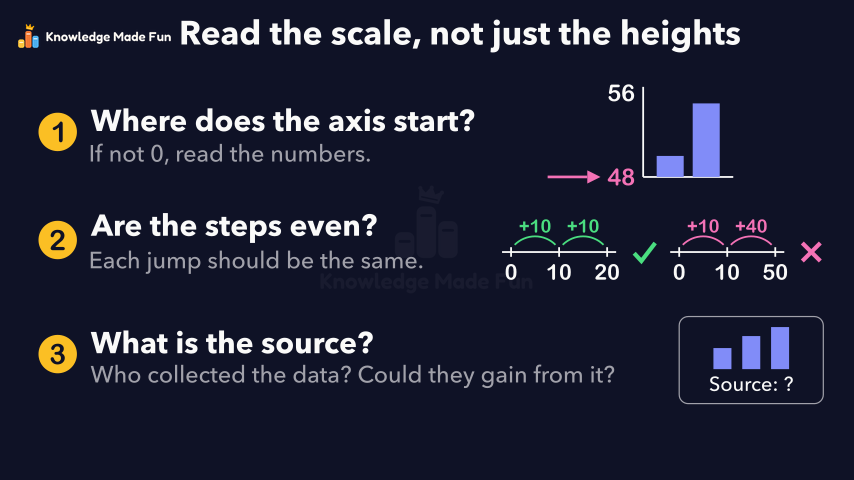
The same café sales, 50 and 55 cups, are drawn twice: from an axis starting at 0, where the bars look close, and from an axis starting at 48, where they show only 2 and 7 so the week 2 bar looks 3.5 times as tall, though the real change is 55 ÷ 50 = 1.1 times. A picture graph then draws 100 cups as one cup twice as tall and twice as wide, so it covers 2 × 2 = 4 times the area, and the video ends with three checks for any graph: where the axis starts, whether the steps are even, and what the source is.
Anyone can watch two lessons on the website without an account. Signing in is free, no payment and no card, and opens three a day; Plus has no limit.
Loading
In one sentence
The question this lesson answers
Can a graph of true numbers still mislead you?
A school café sold 50 hot chocolates in week 1 and 55 in week 2.
Transcript
What the lesson says
Can a graph of true numbers still mislead you?
A school café sold 50 hot chocolates in week 1 and 55 in week 2.
In graph A, the vertical axis, the scale up the side, starts at 0.
The bars reach 50 and 55. They look close, and they are close.
Graph B starts at 48, which cuts off the bottom of each bar. That is a broken axis.
Above 48, the bars show 50 minus 48, which is 2, and 55 minus 48, which is 7.
7 divided by 2 is 3.5, so the week 2 bar looks 3.5 times as tall.
The real change is 55 divided by 50, which is 1.1 times: just 5 more cups.
The common mistake is comparing bar heights without reading the scale.
A picture graph uses pictures for amounts. Say sales doubled, from 50 to 100.
To show 100, it draws the cup twice as tall, so it is twice as wide too.
Its area is 2 times 2, which is 4, so it looks four times as big.
A fair picture graph keeps every cup the same size, one cup for each 50.
Make three checks. First, where does the axis start? If not 0, read the numbers.
Second, are the steps even? Each jump should be the same, not 10 then 40.
Third, what is the source: who collected the data, and could they gain from it?
Read the scale, not just the heights: check the start, the steps and the source.
Curriculum
Where this fits
- British Columbia, Grade 9
Mathematics, Data and probability: statistics in societyBC9-MA-29
Previous: Bias in a Survey: Leading Questions and Unfair SamplesNext: Collecting Data Fairly: Privacy, Consent, Timing and Cost
- British Columbia, Grade 10
Workplace Mathematics 10, Data and probability: create, interpret, and critique graphsBC10-MA-45
Previous: Histograms: bars for ranges of numbersNext: Reading an Infographic Critically
- British Columbia, Grade 11
Workplace Mathematics 11, Interpreting graphs: interpreting graphs in societyBC11-MA-94
This lesson is also listed in Grade 10 and Grade 11.
The outcomes and strands follow the British Columbia curriculum.
Keep going
 1 min 23 s
All the Outcomes of Two Spins: Tables and Tree Diagrams
Grade 7 · 1 min 23 s 1 min 47 s
Bias in a Survey: Leading Questions and Unfair Samples
Grade 9 · 1 min 47 s 1 min
Block Graphs: Which Row Is Longer?
Grade 1 · 1 min 1 min 58 s
Choosing the best average: mean, median or mode
Grade 8 · 1 min 58 s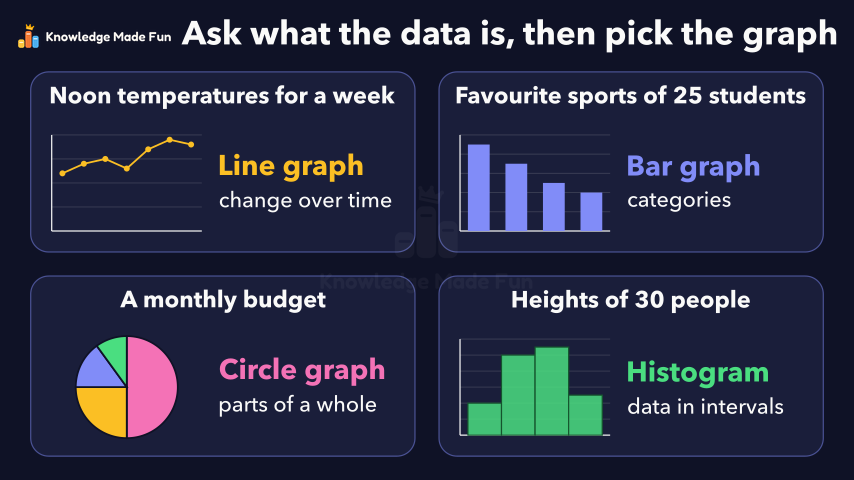 1 min 56 s
Choosing the right graph for the data
Grade 10 · 1 min 56 s 1 min 50 s
Collecting Data Fairly: Privacy, Consent, Timing and Cost
Grade 9 · 1 min 50 s 55 s
Could It Snow Tomorrow? Likely or Unlikely
Kindergarten · 55 s 1 min 27 s
Double bar graphs with a scale
Grade 5 · 1 min 27 s
- All Grade 9 Mathematics lessons
- Try the graph paper, free for everyone, no account needed.
- Create a free account to watch three lessons a day, no payment and no card.