Lesson · Grade 9 · Mathematics
Ways to Choose a Sample, and Which Ones Are Fair
- Grade 9
- Mathematics
- 1 min 59 s
- British Columbia
- BC9-MA-27
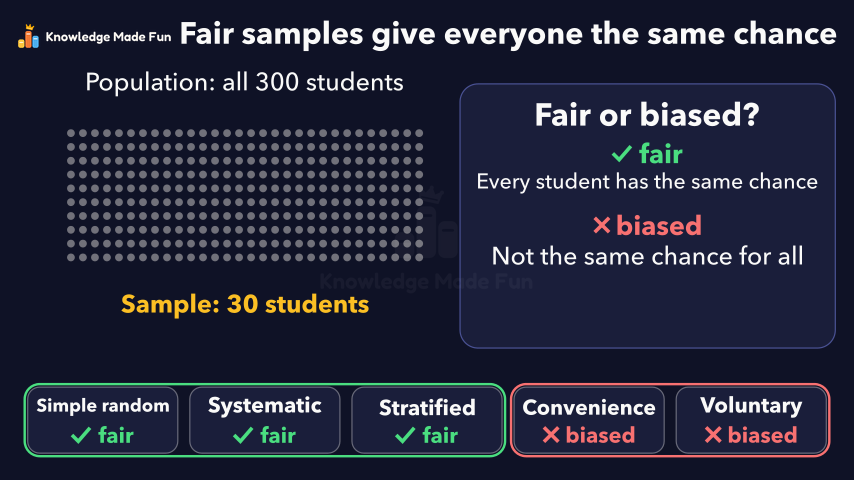
A school of 300 students is sampled five ways to choose 30: names drawn from a hat, every 10th name on the list, some from each grade, whoever is nearby, and whoever answers an online poll. The first three give every student the same 1 in 10 chance and are fair; the last two are biased, and an online poll where 27 of 30 replies say yes speaks only for the people who replied, not for the whole school.
Concept: Ways to choose a sample and which ones are fair
Anyone can watch two lessons on the website without an account. Signing in is free, no payment and no card, and opens three a day; Plus has no limit.
Loading
In one sentence
The question this lesson answers
Do a school's 300 students want a longer lunch? This whole group is the population.
Asking everyone is slow, so we ask a sample, a smaller part: 30 students.
Transcript
What the lesson says
Do a school's 300 students want a longer lunch? This whole group is the population.
Asking everyone is slow, so we ask a sample, a smaller part: 30 students.
A sample is fair if every student has the same chance of being chosen. If not, it is biased.
One: a simple random sample. Put all 300 names in a hat and draw 30.
Each student has a 30 in 300 chance, which is 1 in 10. Fair.
Two: a systematic sample. Pick a random start from 1 to 10, then take every 10th name.
Start at 4: take 4, 14, 24, up to 294. That is 30 names, 1 in 10 each. Fair.
Three: a stratified sample. Split the school into its three grades: 120, 90 and 90 students.
Draw one tenth of each at random: 12, 9 and 9, making 30. Fair.
Four: a convenience sample. Ask the 30 students who happen to be nearby.
They are often friends in one grade, and the other 270 have no chance. Biased.
Five: a voluntary sample. Post an online poll, and whoever chooses to answer is the sample.
Students with strong views answer more, and some never see the poll. Biased.
A common mistake is thinking a poll speaks for everyone. 27 yes out of 30 replies is 90 percent of the replies, not of the school.
Fair samples give everyone the same chance: simple random, systematic and stratified. Convenience and voluntary are biased.
Curriculum
Where this fits
- British Columbia, Grade 9
Mathematics, Data and probability: statistics in societyBC9-MA-27
Previous: Population and sample: why we survey only someNext: Bias in a Survey: Leading Questions and Unfair Samples
The outcomes and strands follow the British Columbia curriculum.
Keep going
 1 min 23 s
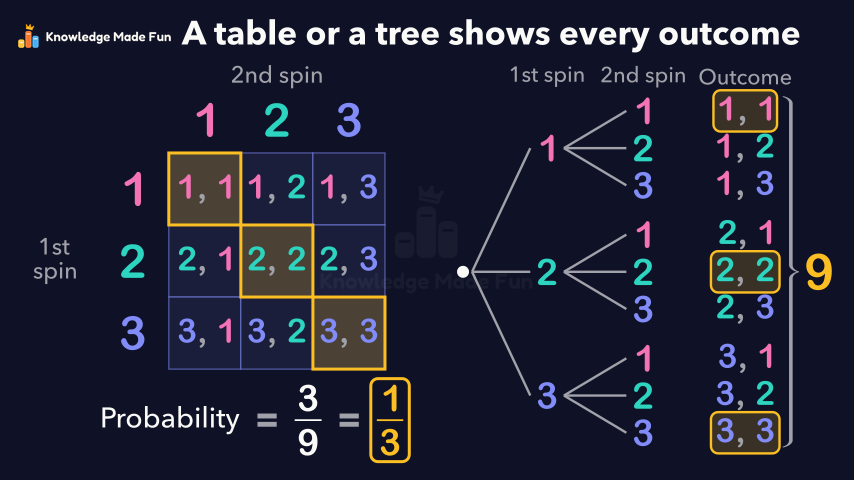
All the Outcomes of Two Spins: Tables and Tree Diagrams
Grade 7 · 1 min 23 s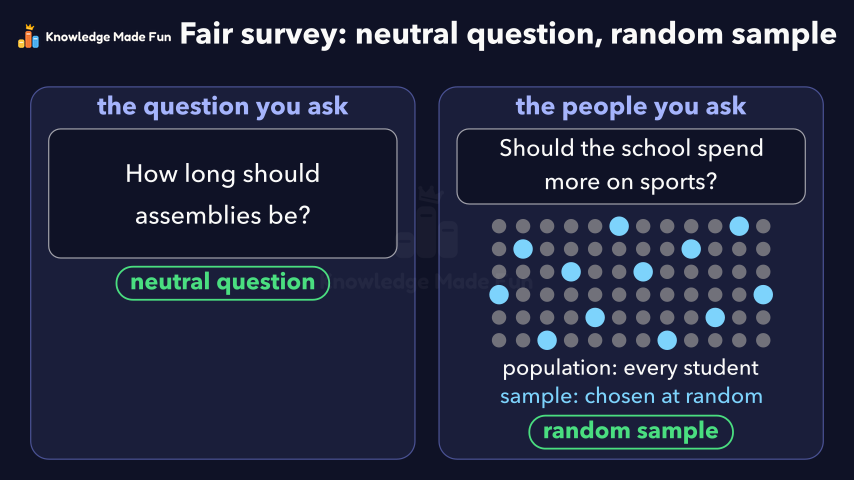 1 min 47 s
Bias in a Survey: Leading Questions and Unfair Samples
Grade 9 · 1 min 47 s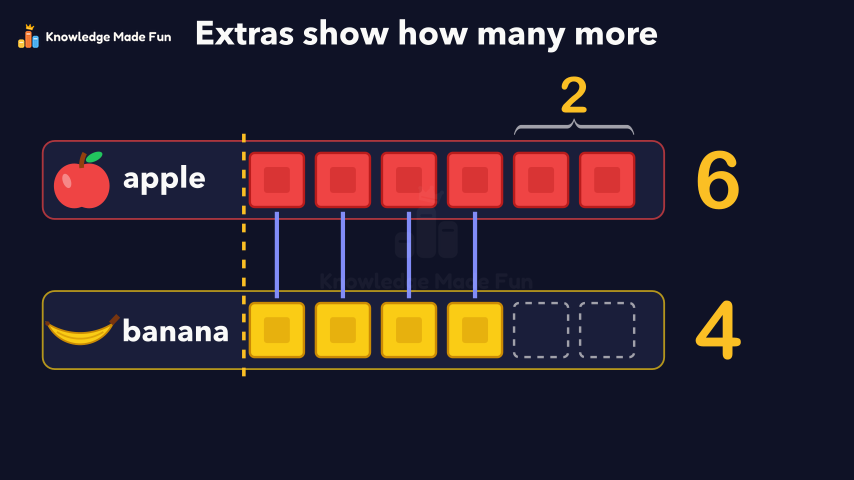 1 min
Block Graphs: Which Row Is Longer?
Grade 1 · 1 min 1 min 58 s
Choosing the best average: mean, median or mode
Grade 8 · 1 min 58 s 1 min 56 s
Choosing the right graph for the data
Grade 10 · 1 min 56 s 1 min 50 s
Collecting Data Fairly: Privacy, Consent, Timing and Cost
Grade 9 · 1 min 50 s 55 s
Could It Snow Tomorrow? Likely or Unlikely
Kindergarten · 55 s 1 min 27 s
Double bar graphs with a scale
Grade 5 · 1 min 27 s
- All Grade 9 Mathematics lessons
- Try the graph paper, free for everyone, no account needed.
- Create a free account to watch three lessons a day, no payment and no card.