Lesson · Grade 9 · Mathematics
Population and sample: why we survey only some
- Grade 9
- Mathematics
- 2 min 3 s
- British Columbia
- BC9-MA-26
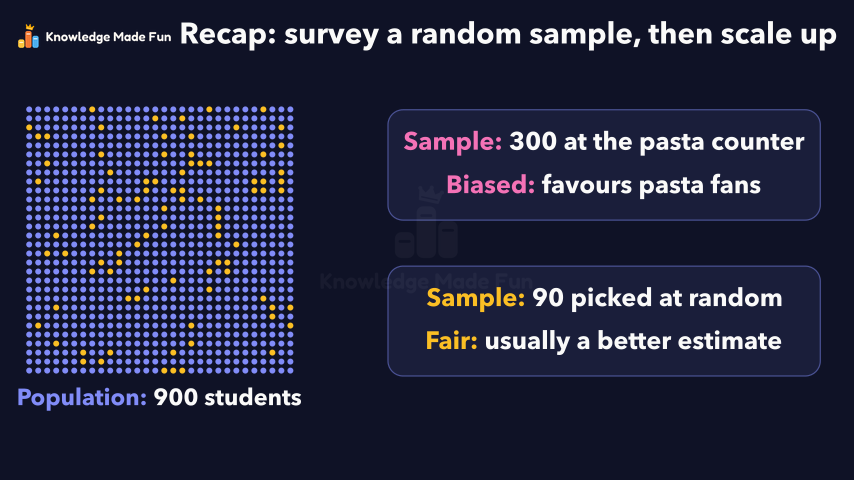
A school of 900 students can't ask everyone, so it surveys a random sample of 90: 36 choose pasta, which is 40%, and 40% of 900 gives an estimate of about 360. The video then shows the common mistake, a big but biased sample of 300 at the pasta counter, and ends by saying to survey a fair random sample and scale its result up.
Anyone can watch two lessons on the website without an account. Signing in is free, no payment and no card, and opens three a day; Plus has no limit.
Loading
In one sentence
The question this lesson answers
A school of 900 students wants to know their favourite lunch. Each dot is one student.
The population is the whole group we want to learn about: here, all 900 students.
Transcript
What the lesson says
A school of 900 students wants to know their favourite lunch. Each dot is one student.
The population is the whole group we want to learn about: here, all 900 students.
Asking every member of the population is called a census. For 900 students, that takes too long.
So the school asks a sample instead: a smaller group of 90 students taken from the population.
The 90 are picked at random, so every student has the same chance of being chosen.
36 of the 90 choose pasta, and the other 54 choose something else.
36 out of 90 is 36 divided by 90, which is 0.4, or 40 percent.
Check: one row of 9 is 10 percent of 90, and 4 times 9 is 36.
Now we estimate, which means make a careful guess, for all 900. 40 percent of 900 is 0.4 times 900, which is 360.
Check: 900 is 10 times 90, so the estimate is 10 times 36, which is 360.
So about 360 of the 900 students would choose pasta. It is an estimate, not an exact count.
A common mistake is to trust a big sample even when it was chosen unfairly.
Suppose we ask 300 students lining up at the pasta counter.
That sample is biased: it was chosen in a way that favours pasta fans.
A smaller random sample, like our 90, usually gives a better estimate than a big biased one.
In short: survey a fair, random sample, then scale its result up to estimate the population.
Curriculum
Where this fits
- British Columbia, Grade 9
Mathematics, Data and probability: statistics in societyBC9-MA-26
The outcomes and strands follow the British Columbia curriculum.
Keep going
 1 min 23 s
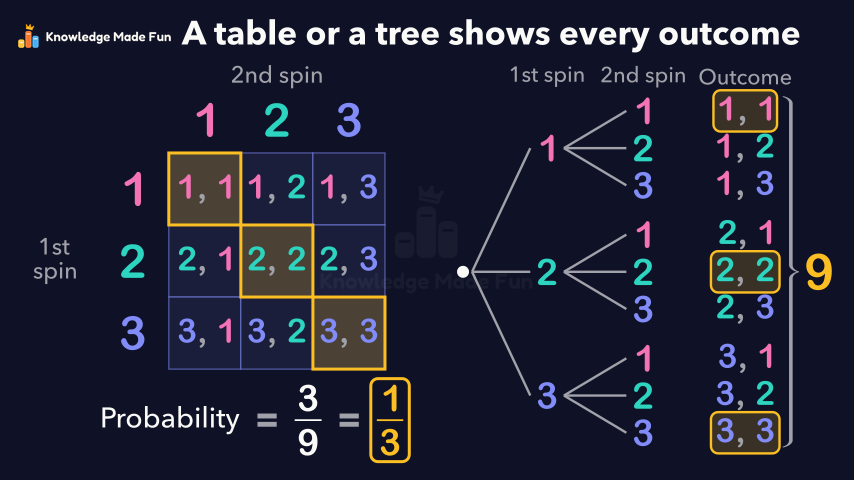
All the Outcomes of Two Spins: Tables and Tree Diagrams
Grade 7 · 1 min 23 s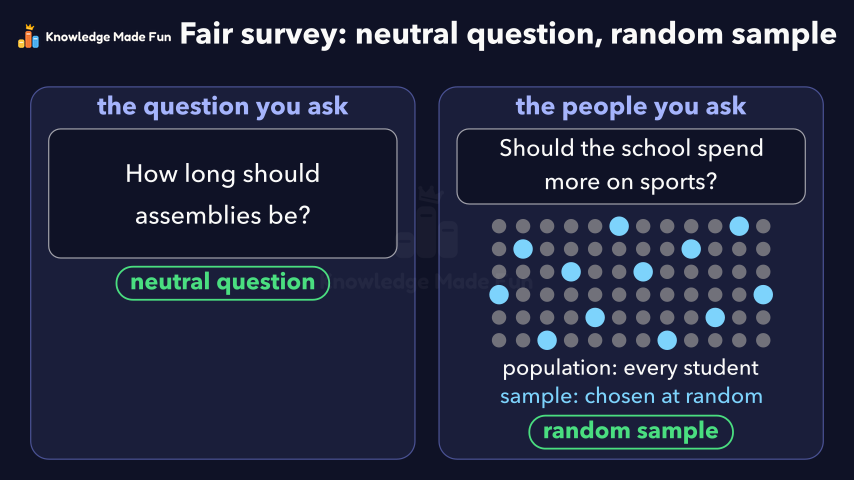 1 min 47 s
Bias in a Survey: Leading Questions and Unfair Samples
Grade 9 · 1 min 47 s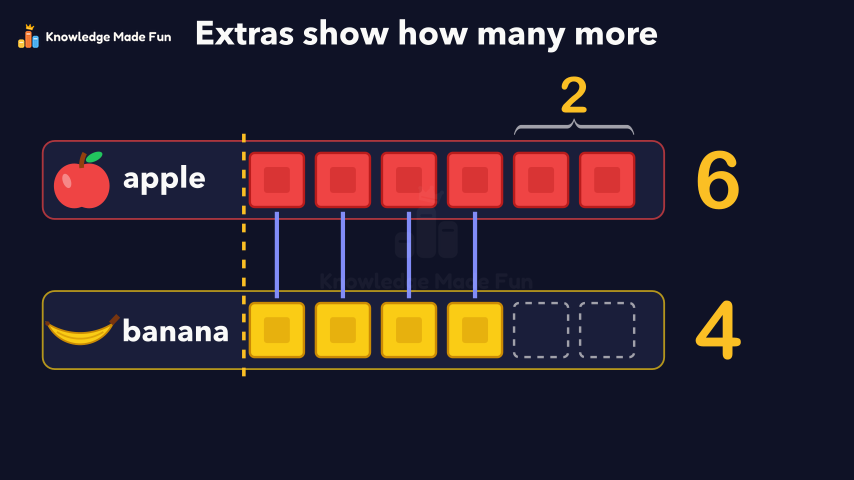 1 min
Block Graphs: Which Row Is Longer?
Grade 1 · 1 min 1 min 58 s
Choosing the best average: mean, median or mode
Grade 8 · 1 min 58 s 1 min 56 s
Choosing the right graph for the data
Grade 10 · 1 min 56 s 1 min 50 s
Collecting Data Fairly: Privacy, Consent, Timing and Cost
Grade 9 · 1 min 50 s 55 s
Could It Snow Tomorrow? Likely or Unlikely
Kindergarten · 55 s 1 min 27 s
Double bar graphs with a scale
Grade 5 · 1 min 27 s
- All Grade 9 Mathematics lessons
- Try the graph paper, free for everyone, no account needed.
- Create a free account to watch three lessons a day, no payment and no card.