Lesson · Grade 7 · Mathematics
Drawing a circle graph from data
- Grade 7
- Mathematics
- 1 min 21 s
- British Columbia
- BC7-MA-66
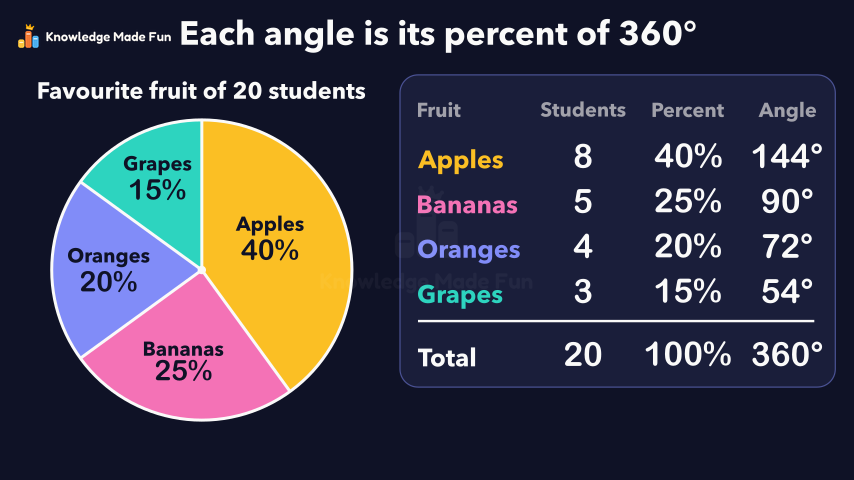
Using the favourite fruits of 20 students, the video adds up the total and turns each count into a percent (8 ÷ 20 = 0.4 = 40%), then turns each percent into an angle (0.4 × 360° = 144°), checking that the percents make 100% and the angles make 360°. It then draws the circle graph step by step: a radius straight up, then a protractor that measures each angle clockwise from the last line, and finishes with labels, a title and a one-line recap.
Anyone can watch two lessons on the website without an account. Signing in is free, no payment and no card, and opens three a day; Plus has no limit.
Loading
In one sentence
The question this lesson answers
How can we show the favourite fruits of 20 students on a circle graph?
First, add up the numbers to get the total, which is 20.
Transcript
What the lesson says
How can we show the favourite fruits of 20 students on a circle graph?
First, add up the numbers to get the total, which is 20.
Next, write each part as a percent of the total.
For apples, 8 divided by 20 is 0.4, which is 40 percent.
Do the same for each fruit, and check that they make 100 percent.
A full circle has 360 degrees.
For apples, 40 percent of 360 degrees is 144 degrees.
The other angles are 90, 72 and 54 degrees, making 360 in all.
Now draw a circle, and a radius from the centre straight up.
Use a protractor to measure 144 degrees, then draw the next radius.
Measure each next angle from the last line you drew.
Label each sector with its name and percent, then add a title.
Find each part's percent, then take that percent of 360 degrees for its angle.
Curriculum
Where this fits
- British Columbia, Grade 7
Mathematics, Data and probability: circle graphsBC7-MA-66
Previous: From a Percent on a Circle Graph to a QuantityNext: Experimental and Theoretical Probability: Flip a Coin, Roll a Die
The outcomes and strands follow the British Columbia curriculum.
Keep going
 1 min 23 s
All the Outcomes of Two Spins: Tables and Tree Diagrams
Grade 7 · 1 min 23 s 1 min 47 s
Bias in a Survey: Leading Questions and Unfair Samples
Grade 9 · 1 min 47 s 1 min
Block Graphs: Which Row Is Longer?
Grade 1 · 1 min 1 min 58 s
Choosing the best average: mean, median or mode
Grade 8 · 1 min 58 s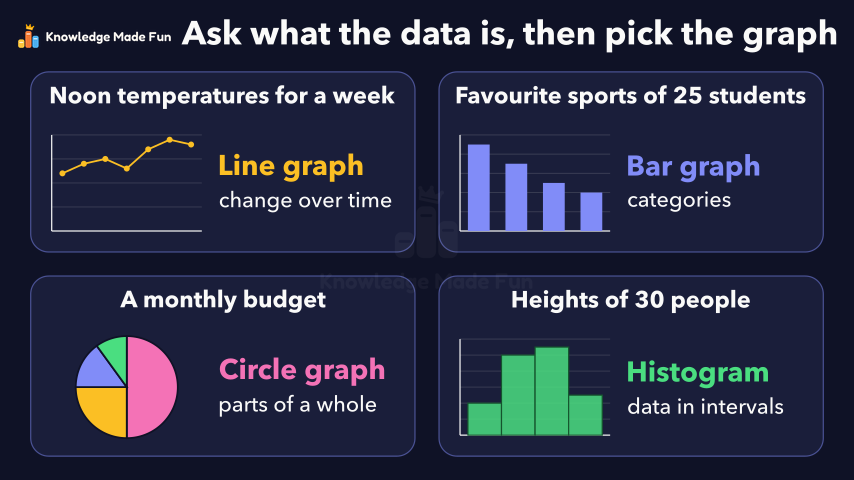 1 min 56 s
Choosing the right graph for the data
Grade 10 · 1 min 56 s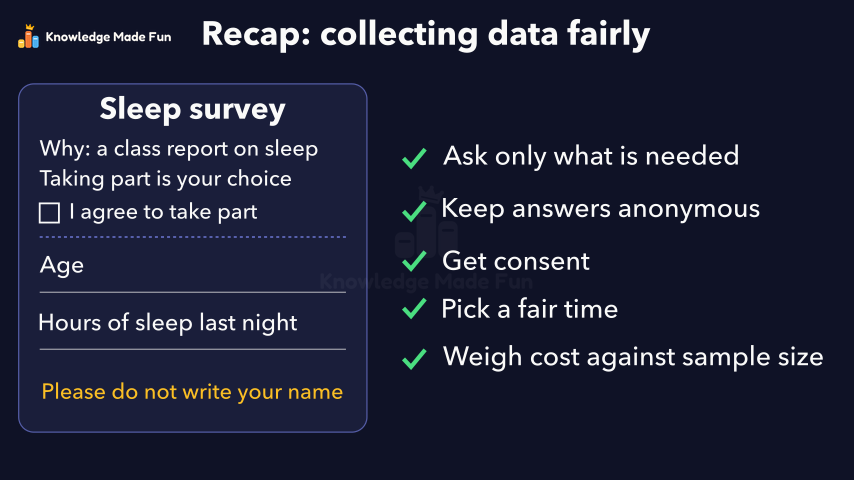 1 min 50 s
Collecting Data Fairly: Privacy, Consent, Timing and Cost
Grade 9 · 1 min 50 s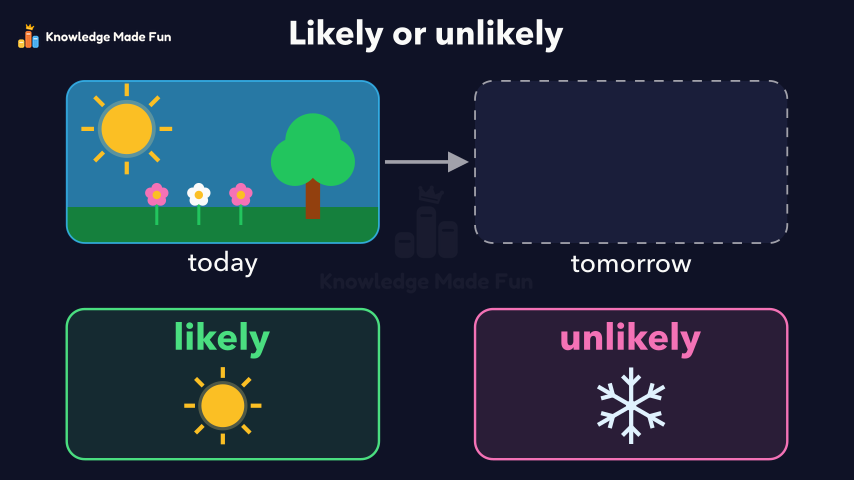 55 s
Could It Snow Tomorrow? Likely or Unlikely
Kindergarten · 55 s 1 min 27 s
Double bar graphs with a scale
Grade 5 · 1 min 27 s
- All Grade 7 Mathematics lessons
- Teachers: the maths worksheets for Grade 7 are in the dashboard, each with a worked example and a proven answer key.
- Try the graph paper, free for everyone, no account needed.
- Create a free account to watch three lessons a day, no payment and no card.