Lesson · Grade 8 · Mathematics
Mean, Median and Mode of a Data Set
- Grade 8
- Mathematics
- 2 min
- British Columbia
- BC8-MA-38
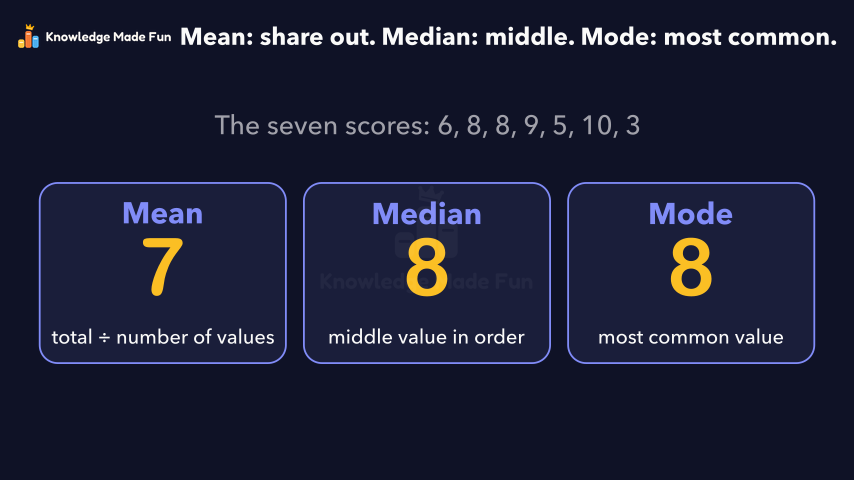
Seven quiz scores are worked three ways: stacks of blocks are levelled to show the mean (49 ÷ 7 = 7), the ordered list gives the median (8), and the most common score gives the mode (8). The video warns against taking the middle before ordering, then adds an eighth score to show that with an even count the median is halfway between the two middle values: (6 + 8) ÷ 2 = 7.
Anyone can watch two lessons on the website without an account. Signing in is free, no payment and no card, and opens three a day; Plus has no limit.
Loading
In one sentence
The question this lesson answers
Here are seven quiz scores: 6, 8, 8, 9, 5, 10 and 3.
A measure of central tendency is one value that describes the centre of a data set.
Transcript
What the lesson says
Here are seven quiz scores: 6, 8, 8, 9, 5, 10 and 3.
A measure of central tendency is one value that describes the centre of a data set.
Three common ones are the mean, the median and the mode.
The mean is the total divided by how many values there are.
Picture each score as a stack of that many blocks.
The total is 6 plus 8 plus 8 plus 9 plus 5 plus 10 plus 3, which is 49.
Now level them out: move blocks from the tall stacks onto the short ones.
Every stack now has 7: 49 divided by 7 is 7, and 7 times 7 is 49. The mean is 7.
The median is the middle of the data once the values are in order.
In order from smallest to largest, they are 3, 5, 6, 8, 8, 9 and 10.
The fourth value has three on each side, so the median is 8.
A common mistake is taking the middle before ordering: that gives 9, not 8.
The mode is the most common value. Only 8 appears twice, so the mode is 8.
Add an eighth score, 4. With an even count, the middle falls between 6 and 8, three on each side.
The median is halfway between them: 6 plus 8 is 14, and 14 divided by 2 is 7.
For the seven scores, the mean is 7, the median is 8 and the mode is 8.
The mean shares the total evenly, the median is the middle in order, the mode is the most common.
Curriculum
Where this fits
- British Columbia, Grade 8
Mathematics, Data and probability: central tendencyBC8-MA-38
- British Columbia, Grade 10
Workplace Mathematics 10, Data and probability: central tendencyBC10-MA-57
Previous: Reading an Infographic CriticallyNext: Choosing the best average: mean, median or mode
This lesson is also listed in Grade 10.
The outcomes and strands follow the British Columbia curriculum.
Keep going
 1 min 23 s
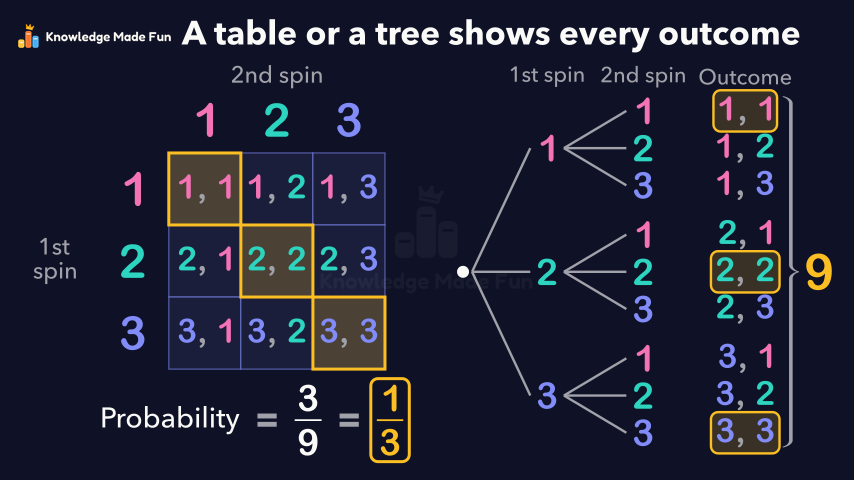
All the Outcomes of Two Spins: Tables and Tree Diagrams
Grade 7 · 1 min 23 s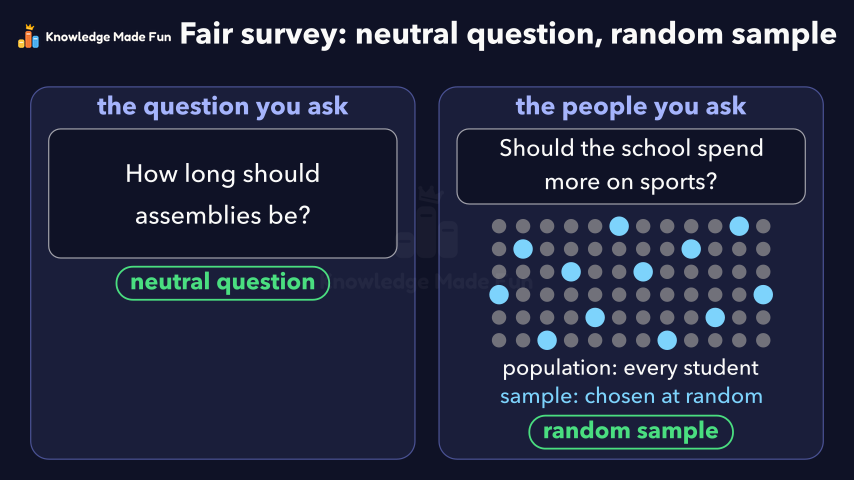 1 min 47 s
Bias in a Survey: Leading Questions and Unfair Samples
Grade 9 · 1 min 47 s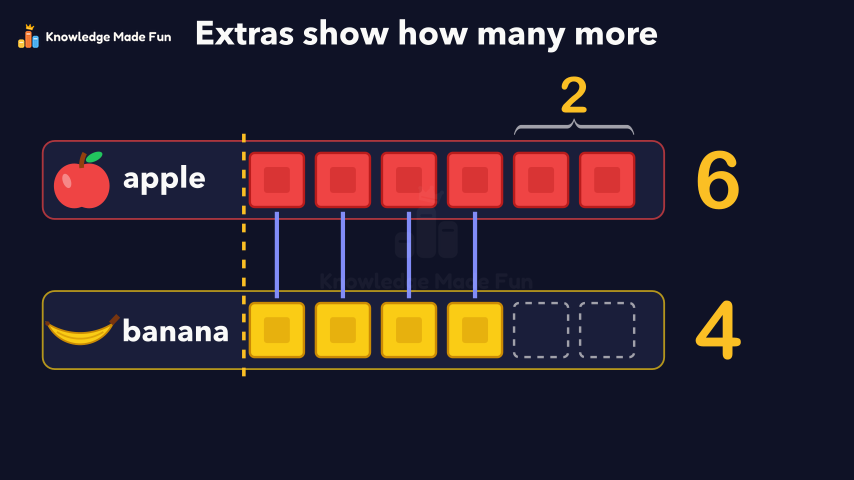 1 min
Block Graphs: Which Row Is Longer?
Grade 1 · 1 min 1 min 58 s
Choosing the best average: mean, median or mode
Grade 8 · 1 min 58 s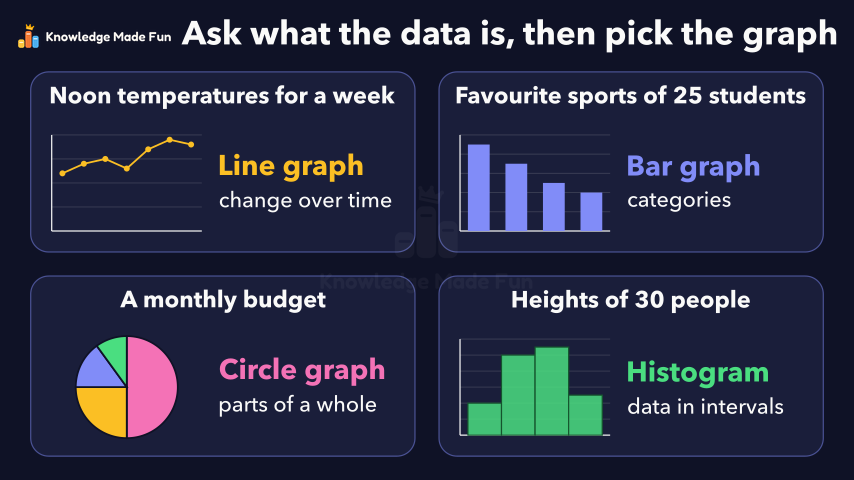 1 min 56 s
Choosing the right graph for the data
Grade 10 · 1 min 56 s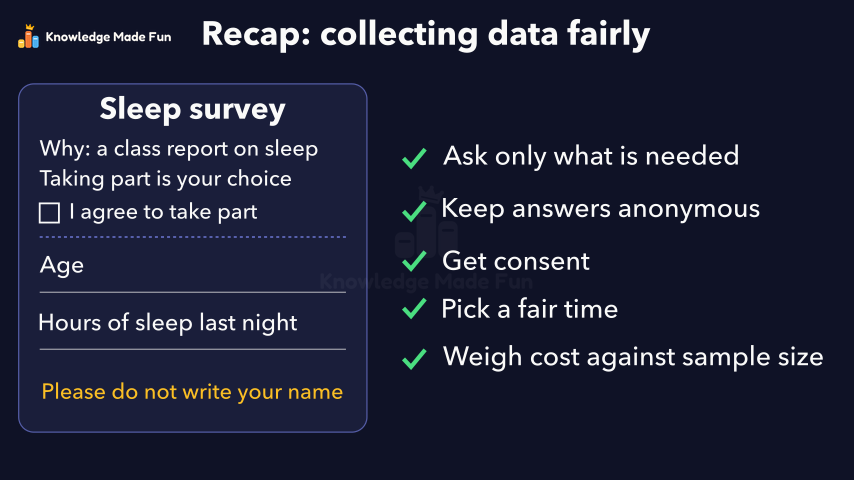 1 min 50 s
Collecting Data Fairly: Privacy, Consent, Timing and Cost
Grade 9 · 1 min 50 s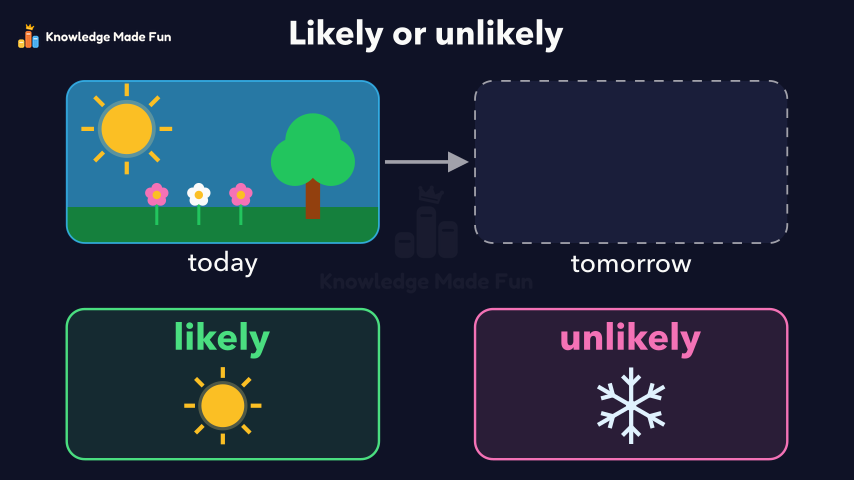 55 s
Could It Snow Tomorrow? Likely or Unlikely
Kindergarten · 55 s 1 min 27 s
Double bar graphs with a scale
Grade 5 · 1 min 27 s
- All Grade 8 Mathematics lessons
- Try the graph paper, free for everyone, no account needed.
- Create a free account to watch three lessons a day, no payment and no card.