Lesson · Grade 9 · Mathematics
Interpolating and extrapolating from a linear graph
- Grade 9
- Mathematics
- 2 min 4 s
- British Columbia
- BC9-MA-18
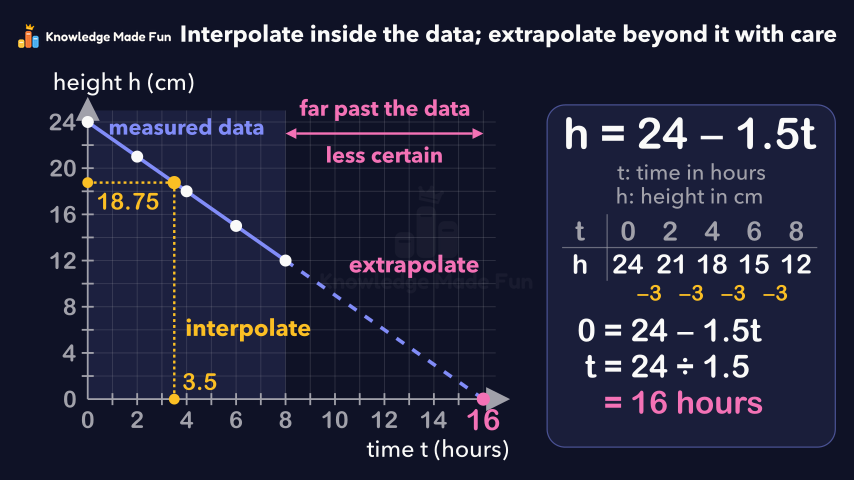
A 24 cm candle that burns 1.5 cm an hour (h = 24 − 1.5t) is measured every 2 hours up to 8 hours and graphed as a straight line. The video reads the line at 3.5 hours to interpolate about 19 cm, which the equation confirms as 18.75 cm. It then extends the line to h = 0 to extrapolate a burn-out time of 16 hours, warns against reading from the wrong axis, and explains that a value so far past the data is less certain.
Concept: Interpolating and extrapolating from a graph
Anyone can watch two lessons on the website without an account. Signing in is free, no payment and no card, and opens three a day; Plus has no limit.
Loading
In one sentence
The question this lesson answers
A 24 centimetre candle burns down 1.5 centimetres every hour.
After t hours, its height in centimetres is h equals 24 minus 1.5 t.
Transcript
What the lesson says
A 24 centimetre candle burns down 1.5 centimetres every hour.
After t hours, its height in centimetres is h equals 24 minus 1.5 t.
Time t goes along the horizontal axis, and height h goes up the vertical axis.
We measured it every 2 hours for 8 hours: 24, 21, 18, 15 and 12 centimetres.
It drops 3 centimetres every 2 hours, so the points lie on a straight line: a linear relation.
Interpolating means estimating a value between the data points.
How tall is the candle after 3.5 hours?
3.5 is a time, so start on the time axis and go straight up to the line.
Then go across to the height axis. It reads about 19 centimetres.
Check: 24 minus 1.5 times 3.5 is 24 minus 5.25, which is 18.75 centimetres.
A common mistake is to find 3.5 on the height axis, but 3.5 is a time.
Extrapolating means extending the line past the data, to estimate beyond it.
The candle burns out when h is 0, where the line meets the time axis: at 16 hours.
Check: 0 equals 24 minus 1.5 t, so t equals 24 divided by 1.5, which is 16.
Our data stops at 8 hours. The rate could change, so a value this far past the data is less certain.
Interpolate inside the data, and extrapolate beyond it with care.
Curriculum
Where this fits
- British Columbia, Grade 9
Mathematics, Patterns and algebra: two-variable linear relations, using graphing, interpolation, and extrapolationBC9-MA-18
Previous: Horizontal and vertical lines: y = 3 and x = −2Next: Solving Equations with Brackets and Like Terms
- British Columbia, Grade 11
Physics 11, Graphs and data: graphical methods in physicsBC11-SC-246
This lesson is also listed in Grade 11.
The outcomes and strands follow the British Columbia curriculum.
Keep going
 1 min 51 s
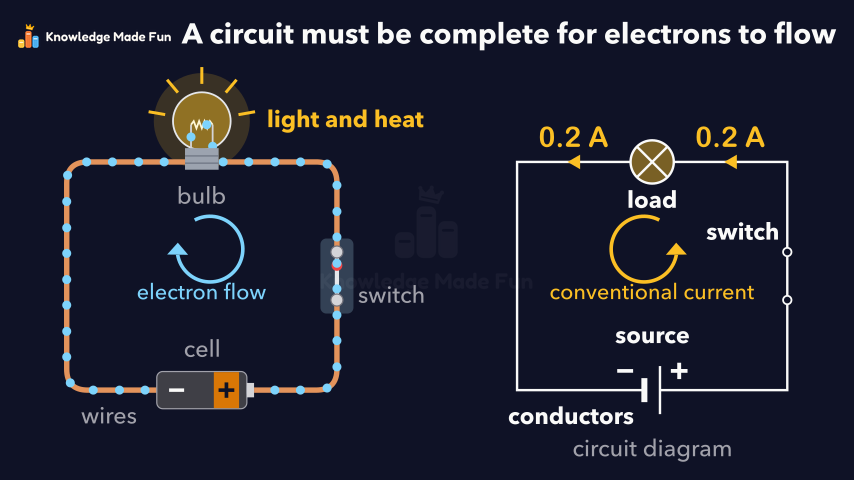
A Complete Circuit: Source, Load, Conductors and Switch
Grade 9 · 1 min 51 s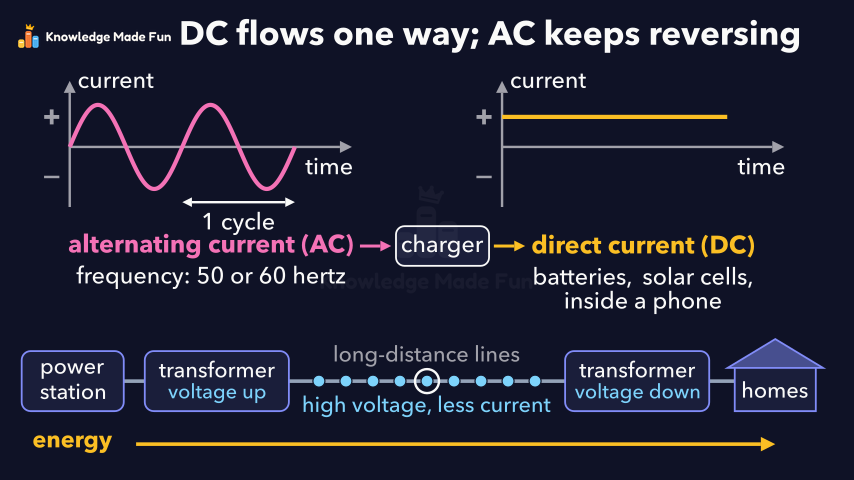 1 min 48 s
AC and DC: Two Ways Current Can Flow
Grade 9 · 1 min 48 s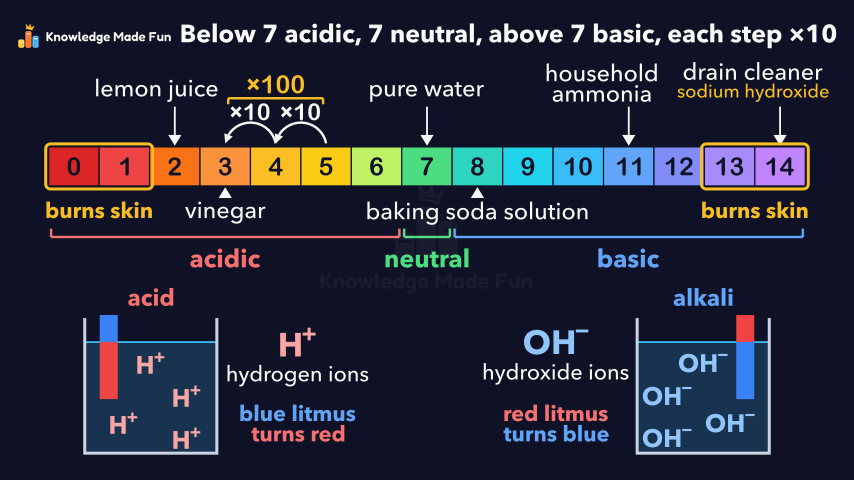 1 min 40 s
Acids and bases: the pH scale
Grade 10 · 1 min 40 s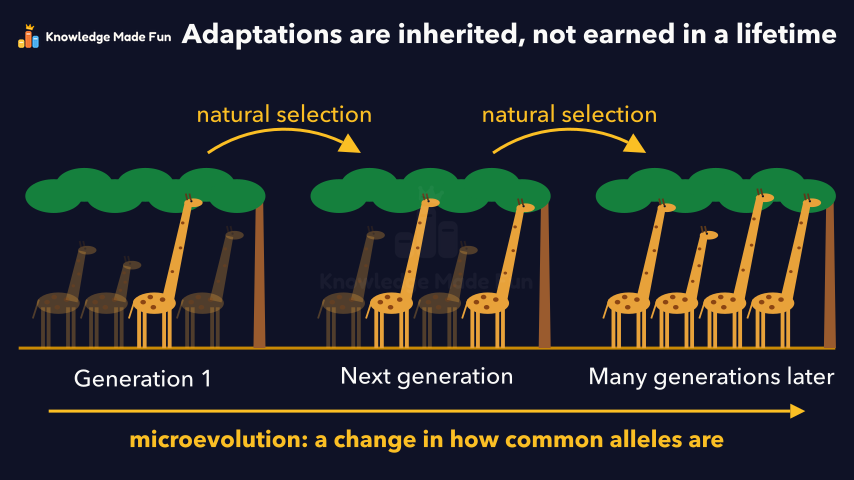 1 min 39 s
Adaptations Are Inherited, Not Earned in a Lifetime
Grade 11 · 1 min 39 s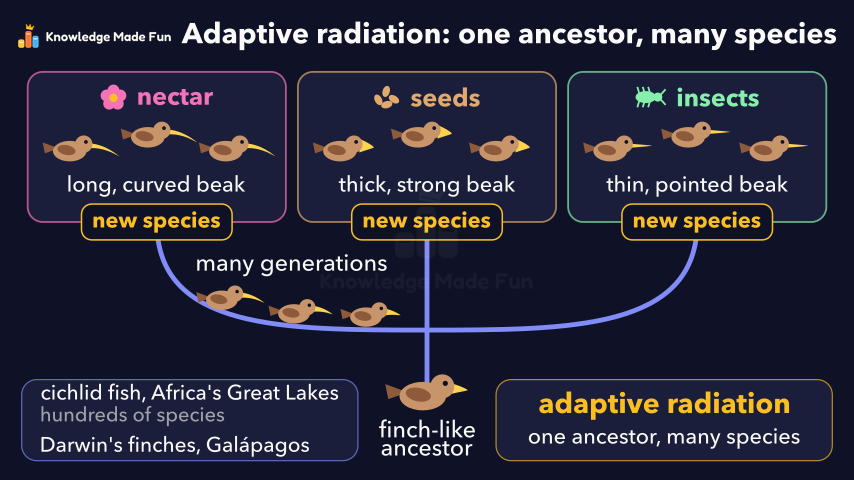 1 min 48 s
Adaptive radiation: one ancestor, many species
Grade 10 · 1 min 48 s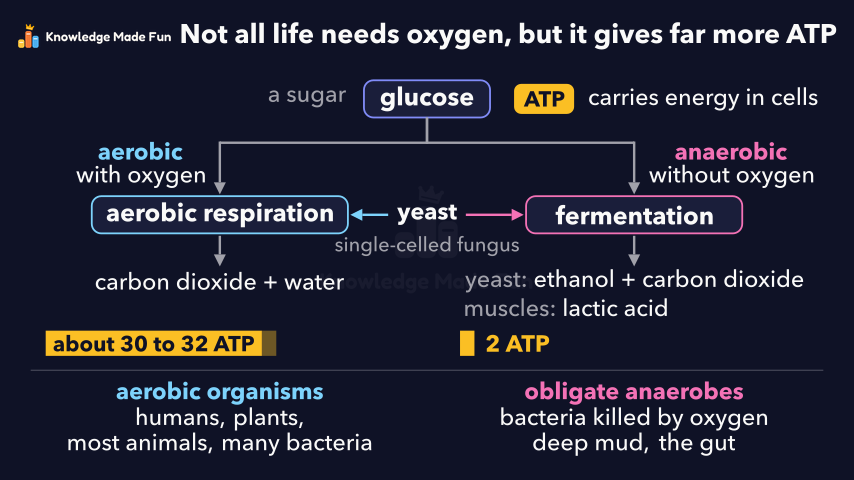 1 min 39 s
Aerobic and anaerobic organisms
Grade 11 · 1 min 39 s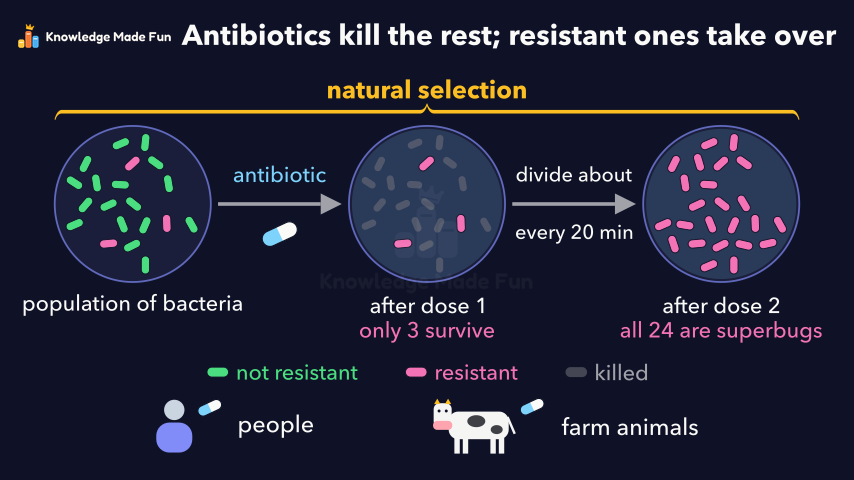 1 min 37 s
Antibiotic resistance: how superbugs evolve
Grade 8 · 1 min 37 s 1 min 35 s
Antibiotics kill bacteria, not viruses
Grade 8 · 1 min 35 s
- All Grade 9 Mathematics lessons
- Try the graph paper, free for everyone, no account needed.
- Create a free account to watch three lessons a day, no payment and no card.