Lesson · Grade 7 · Mathematics
Reading a circle graph
- Grade 7
- Mathematics
- 59 s
- British Columbia
- BC7-MA-64
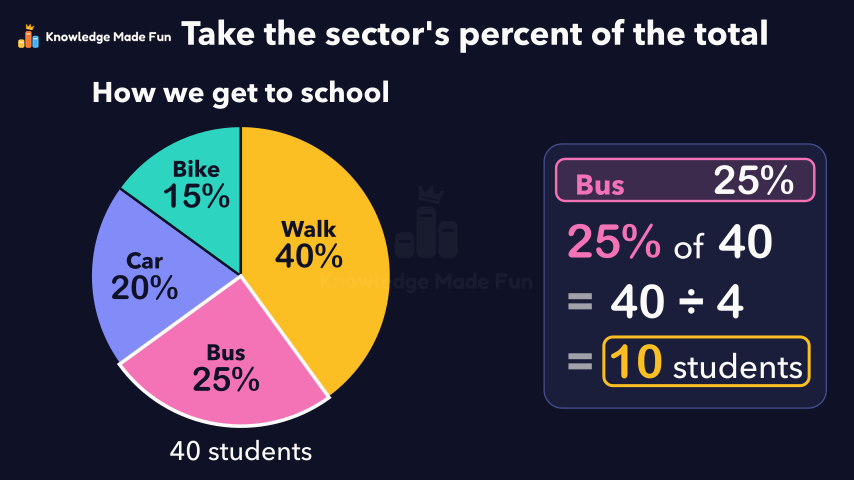
A circle graph shows how 40 students get to school (Walk 40%, Bus 25%, Car 20%, Bike 15%): each sector is one part of the group, the sectors add up to 100%, and the biggest sector is the most common answer. To find how many take the bus, the video shows that the 25% sector is one quarter of the circle, so 25% of 40 = 40 ÷ 4 = 10 students, and it ends on the recap: take the sector's percent of the total.
Anyone can watch two lessons on the website without an account. Signing in is free, no payment and no card, and opens three a day; Plus has no limit.
Loading
In one sentence
The question this lesson answers
We asked 40 students how they get to school.
A circle graph shows the whole group as one circle.
Transcript
What the lesson says
We asked 40 students how they get to school.
A circle graph shows the whole group as one circle.
Each slice, called a sector, shows one part of the group.
Together, all the sectors add up to 100 percent.
Walk has the biggest sector, so walking is the most common way.
How many of the 40 students take the bus?
The bus sector shows 25 percent.
25 percent is one quarter of the whole circle.
So we need 25 percent of the 40 students.
One quarter of 40 means 40 divided by 4.
40 divided by 4 is 10, so 10 students take the bus.
To read a circle graph, take the sector's percent of the total.
Curriculum
Where this fits
- British Columbia, Grade 7
Mathematics, Data and probability: circle graphsBC7-MA-64
The outcomes and strands follow the British Columbia curriculum.
Keep going
 1 min 23 s
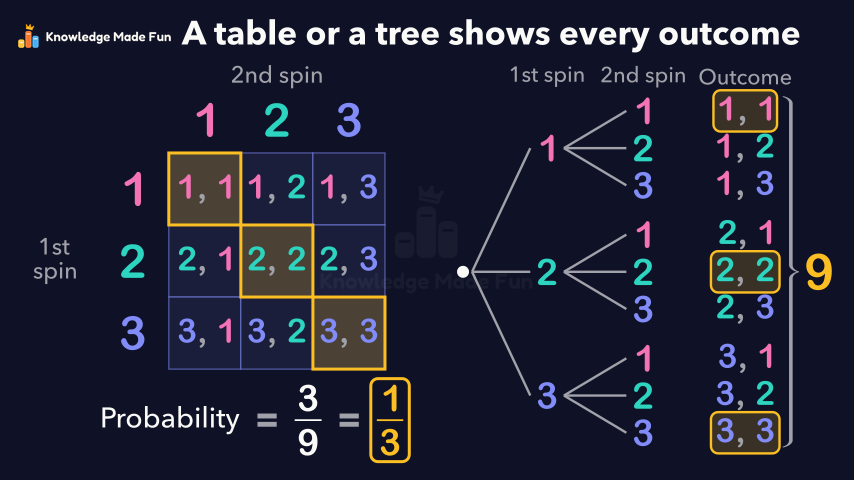
All the Outcomes of Two Spins: Tables and Tree Diagrams
Grade 7 · 1 min 23 s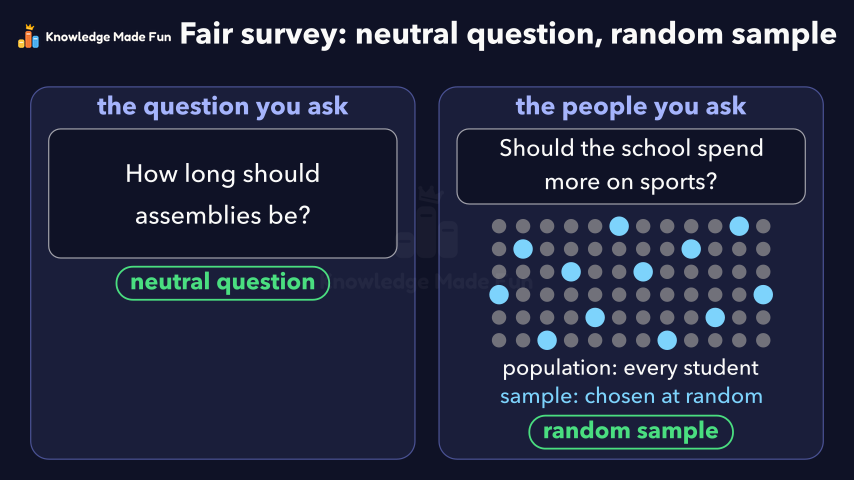 1 min 47 s
Bias in a Survey: Leading Questions and Unfair Samples
Grade 9 · 1 min 47 s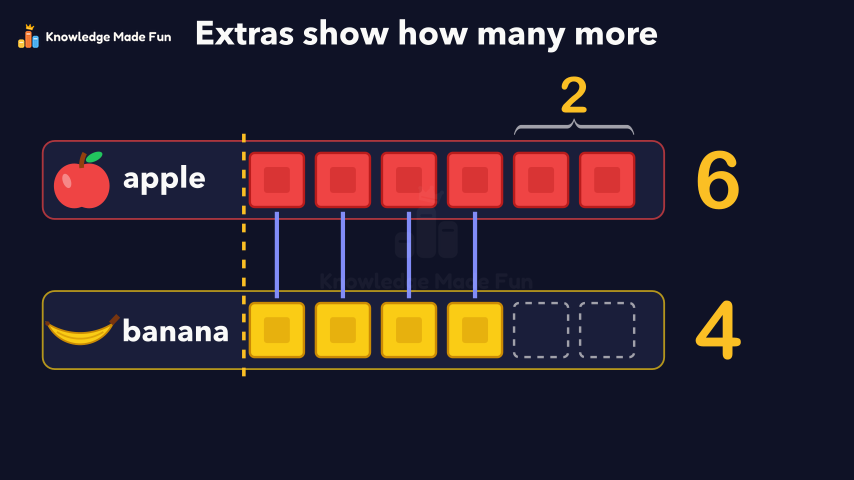 1 min
Block Graphs: Which Row Is Longer?
Grade 1 · 1 min 1 min 58 s
Choosing the best average: mean, median or mode
Grade 8 · 1 min 58 s 1 min 56 s
Choosing the right graph for the data
Grade 10 · 1 min 56 s 1 min 50 s
Collecting Data Fairly: Privacy, Consent, Timing and Cost
Grade 9 · 1 min 50 s 55 s
Could It Snow Tomorrow? Likely or Unlikely
Kindergarten · 55 s 1 min 27 s
Double bar graphs with a scale
Grade 5 · 1 min 27 s
- All Grade 7 Mathematics lessons
- Teachers: the maths worksheets for Grade 7 are in the dashboard, each with a worked example and a proven answer key.
- Try the graph paper, free for everyone, no account needed.
- Create a free account to watch three lessons a day, no payment and no card.