Lesson · Grade 10 · Workplace Mathematics
Range and Outliers: How One Late Delivery Changes the Measures
- Grade 10
- Workplace Mathematics
- 2 min 4 s
- British Columbia
- BC10-MA-59
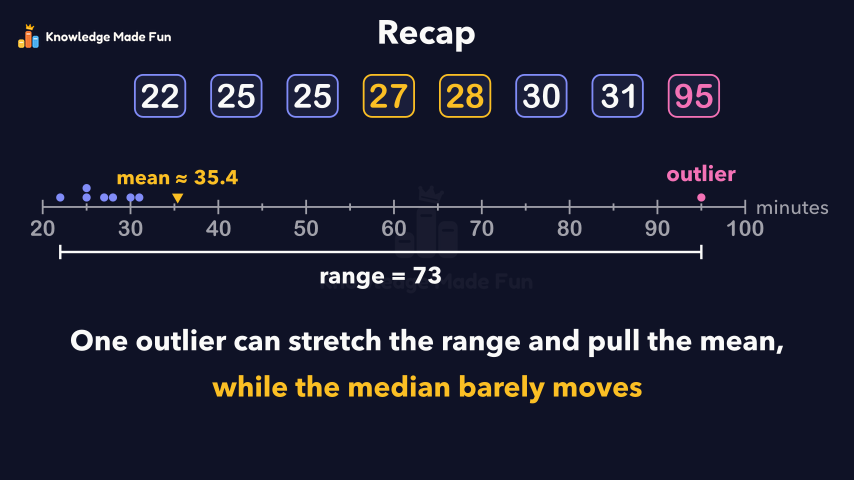
Seven delivery times have a range of 9, a mean of about 26.9 and a median of 27; adding one late delivery of 95 minutes makes the range 73 and the mean about 35.4, while the median only moves to 27.5. The video then asks whether to keep the outlier: correct or remove a mistake in the record, keep a real delay, and never delete an outlier without first asking why it is there.
Concept: Range and outliers: how one extreme value changes the measures
Anyone can watch two lessons on the website without an account. Signing in is free, no payment and no card, and opens three a day; Plus has no limit.
Loading
In one sentence
The question this lesson answers
How much can one extreme value change a summary of data?
A shop records seven delivery times, in minutes: 22, 25, 25, 27, 28, 30 and 31.
Transcript
What the lesson says
How much can one extreme value change a summary of data?
A shop records seven delivery times, in minutes: 22, 25, 25, 27, 28, 30 and 31.
The range is the largest value minus the smallest, a measure of spread: 31 minus 22 is 9.
The mean and the median are measures of central tendency: each gives a typical value.
The mean is the total divided by the number of values: 188 divided by 7 is about 26.9.
The median is the middle value in order. With seven values, it is the fourth: 27.
Now add one late delivery of 95 minutes.
A value far from the rest of the data is called an outlier.
The range jumps to 73, because 95 minus 22 is 73.
The mean is now 283 divided by 8, about 35.4, more than seven of the eight times.
With eight values, the median is halfway between 27 and 28, which is 27.5.
One value moved the range by 64 and the mean by about 8.5, but the median by only half a minute.
Should we remove the 95? First, ask why it is there.
If it is a mistake in the record, such as a typing error, correct it or leave it out.
If it is a real delay, keep it: the shop needs to know about it.
A common mistake is deleting every outlier without asking why it is there.
Recap: one outlier can stretch the range and pull the mean, while the median barely moves.
Curriculum
Where this fits
- British Columbia, Grade 10
Workplace Mathematics 10, Data and probability: central tendencyBC10-MA-59
Previous: Choosing the best average: mean, median or modeNext: Simulating a game to estimate a probability
The outcomes and strands follow the British Columbia curriculum.
Keep going
 1 min 23 s
All the Outcomes of Two Spins: Tables and Tree Diagrams
Grade 7 · 1 min 23 s 1 min 47 s
Bias in a Survey: Leading Questions and Unfair Samples
Grade 9 · 1 min 47 s 1 min
Block Graphs: Which Row Is Longer?
Grade 1 · 1 min 1 min 58 s
Choosing the best average: mean, median or mode
Grade 8 · 1 min 58 s 1 min 56 s
Choosing the right graph for the data
Grade 10 · 1 min 56 s 1 min 50 s
Collecting Data Fairly: Privacy, Consent, Timing and Cost
Grade 9 · 1 min 50 s 55 s
Could It Snow Tomorrow? Likely or Unlikely
Kindergarten · 55 s 1 min 27 s
Double bar graphs with a scale
Grade 5 · 1 min 27 s
- All Grade 10 Workplace Mathematics lessons
- Create a free account to watch three lessons a day, no payment and no card.