Lesson · Grade 10 · Workplace Mathematics
Simulation vs Theory: Rolling a Sum of 7
- Grade 10
- Workplace Mathematics
- 2 min 17 s
- British Columbia
- BC10-MA-61
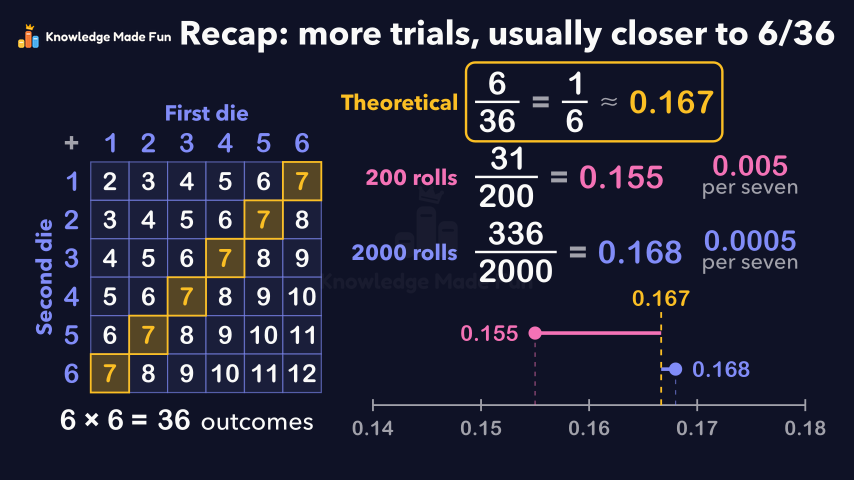
A 6 by 6 table of two-dice outcomes clears up the common belief that all 11 sums are equally likely, and gives the theoretical probability of rolling a 7 as 6/36 = 1/6, about 0.167. Simulations of 200 rolls (31/200 = 0.155) and 2000 rolls (336/2000 = 0.168) are plotted on a number line to show why random results differ from theory and why more trials usually close the gap.
Concept: Comparing a simulation with theoretical probability
Anyone can watch two lessons on the website without an account. Signing in is free, no payment and no card, and opens three a day; Plus has no limit.
Loading
In one sentence
The question this lesson answers
Roll two dice and add them: 3 and 4 make 7. How often should the sum be 7?
A common mistake is to say the 11 sums, from 2 to 12, each have a chance of 1 in 11.
Transcript
What the lesson says
Roll two dice and add them: 3 and 4 make 7. How often should the sum be 7?
A common mistake is to say the 11 sums, from 2 to 12, each have a chance of 1 in 11.
An outcome is one possible result. This table shows every outcome, with the sum of the two dice in each cell.
6 times 6 gives 36 outcomes, all equally likely with fair dice.
Now count the cells with a sum of 7: 1, 2, 3, 4, 5, 6.
A sum of 2 appears only once, so the sums are not equally likely.
Theoretical probability comes from reasoning. For equally likely outcomes, it is the outcomes we want over all outcomes.
That is 6 over 36, or one sixth, about 0.167.
Experimental probability comes from trials. A trial is one roll of both dice, and a simulation runs many trials on a computer.
A simulation of 200 rolls gave 31 sevens, so the experimental probability is 31 over 200, or 0.155.
That is close to 0.167, but not equal.
They differ because each roll is random. In 200 rolls, one seven moves the result by 0.005.
A second simulation of 2000 rolls gave 336 sevens. 336 over 2000 is 0.168, much closer to 0.167.
In 2000 rolls, one seven moves the result by only 0.0005.
With more trials, random ups and downs even out, so the result usually gets closer to the theory.
Recap: theory gives 6 over 36, about 0.167, and more trials usually bring a simulation closer.
Curriculum
Where this fits
- British Columbia, Grade 10
Workplace Mathematics 10, Data and probability: experimental probabilityBC10-MA-61
The outcomes and strands follow the British Columbia curriculum.
Keep going
 1 min 23 s
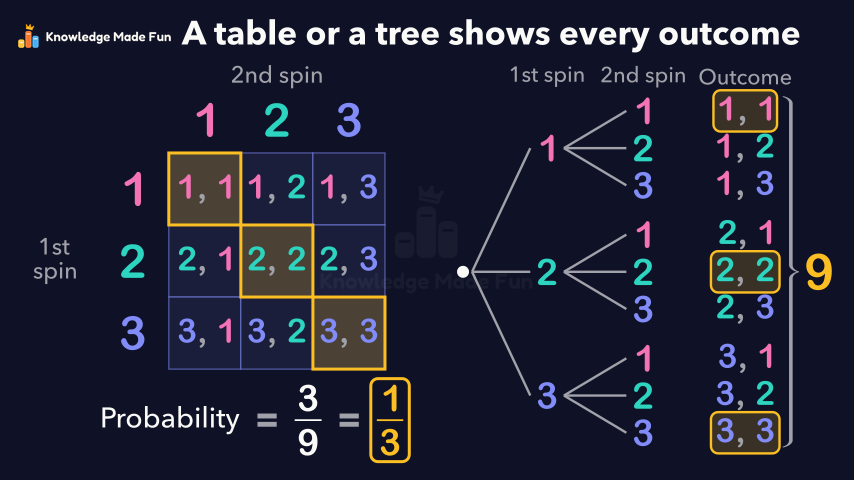
All the Outcomes of Two Spins: Tables and Tree Diagrams
Grade 7 · 1 min 23 s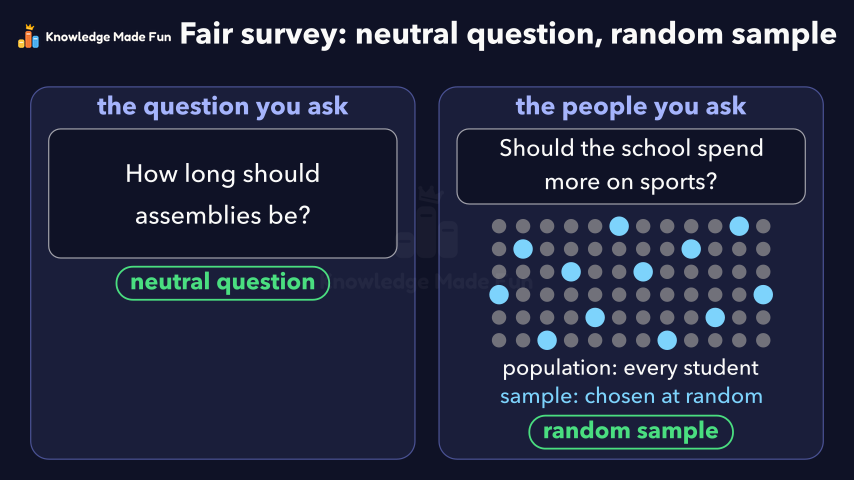 1 min 47 s
Bias in a Survey: Leading Questions and Unfair Samples
Grade 9 · 1 min 47 s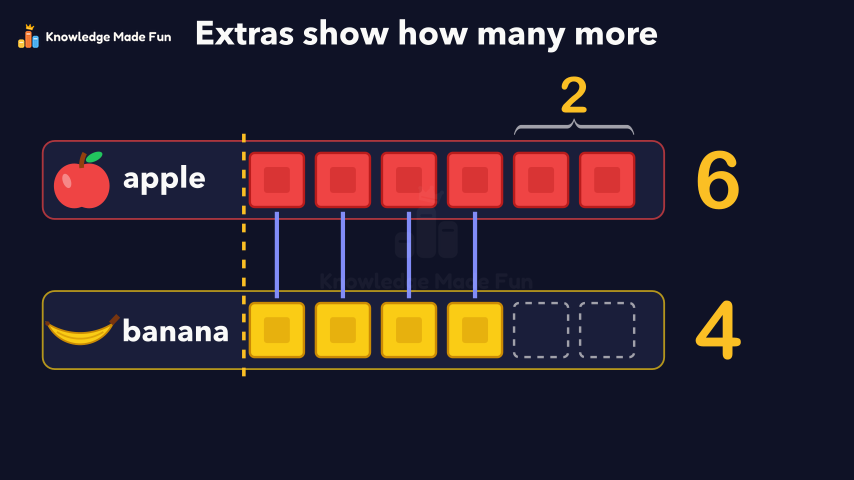 1 min
Block Graphs: Which Row Is Longer?
Grade 1 · 1 min 1 min 58 s
Choosing the best average: mean, median or mode
Grade 8 · 1 min 58 s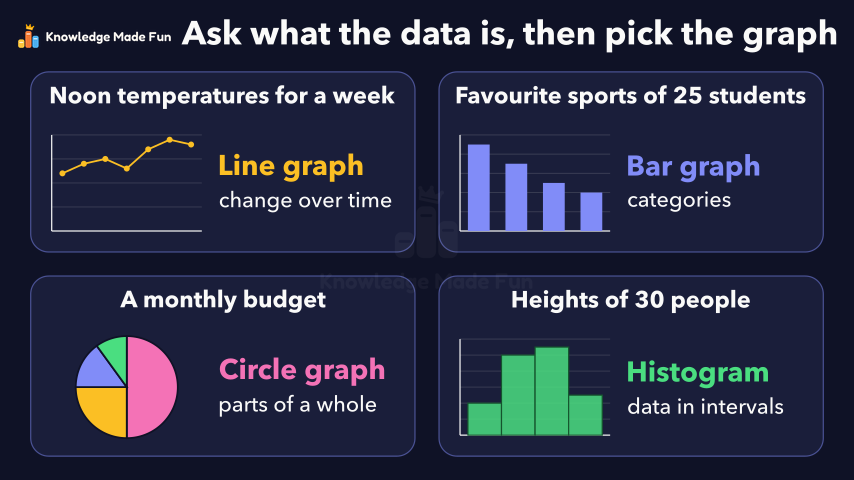 1 min 56 s
Choosing the right graph for the data
Grade 10 · 1 min 56 s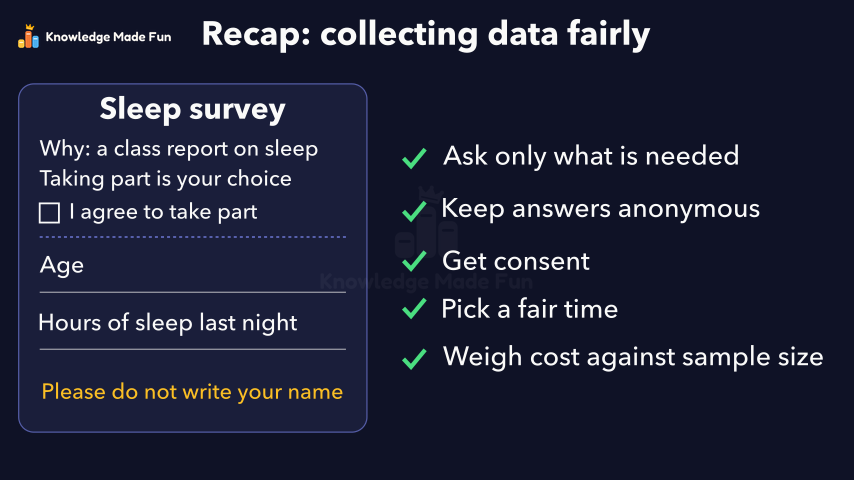 1 min 50 s
Collecting Data Fairly: Privacy, Consent, Timing and Cost
Grade 9 · 1 min 50 s 55 s
Could It Snow Tomorrow? Likely or Unlikely
Kindergarten · 55 s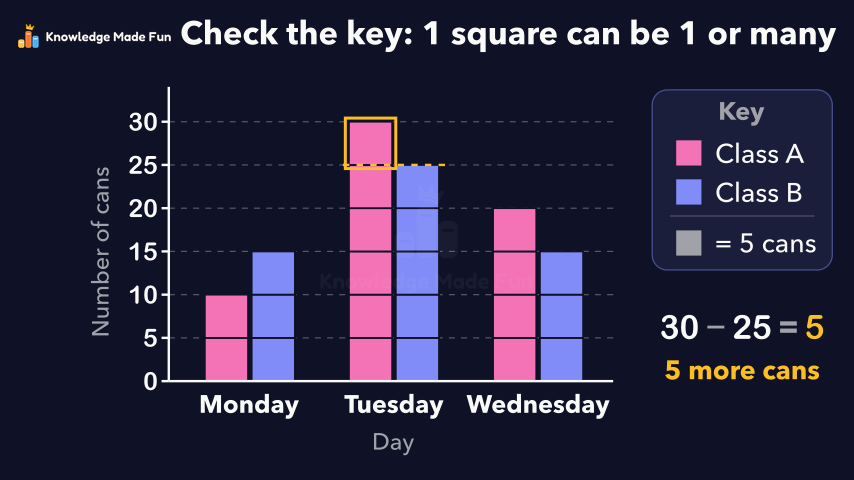 1 min 27 s
Double bar graphs with a scale
Grade 5 · 1 min 27 s
- All Grade 10 Workplace Mathematics lessons
- Create a free account to watch three lessons a day, no payment and no card.