Lesson · Grade 8 · Mathematics
One Relation, Three Ways: Expression, Table and Graph
- Grade 8
- Mathematics
- 2 min 8 s
- British Columbia
- BC8-MA-19
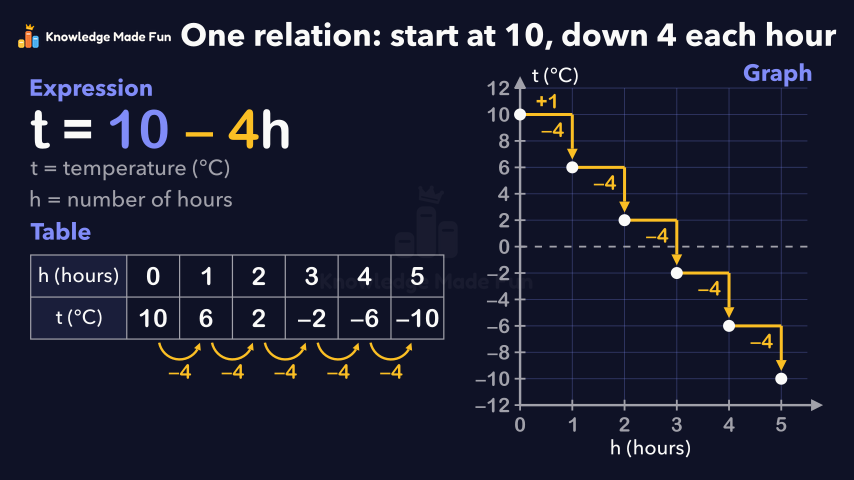
A temperature that starts at 10°C and drops 4°C each hour is written as t = 10 − 4h, then each whole hour from 0 to 5 is substituted to fill a table (10, 6, 2, −2, −6, −10) and plotted as separate dots, explaining "discrete" and "linear" along the way. The video shows the same −4 as the number in front of h, as the change along the table and as each "1 right, 4 down" step on the graph, and warns against reading −4 as +4 and drawing the points going up.
Anyone can watch two lessons on the website without an account. Signing in is free, no payment and no card, and opens three a day; Plus has no limit.
Loading
In one sentence
The question this lesson answers
A relation links two quantities. Let's show one as an expression, a table and a graph.
The temperature starts at 10 degrees Celsius and drops 4 degrees each hour. Let t be the temperature and h the number of hours.
Transcript
What the lesson says
A relation links two quantities. Let's show one as an expression, a table and a graph.
The temperature starts at 10 degrees Celsius and drops 4 degrees each hour. Let t be the temperature and h the number of hours.
In symbols, t equals 10 minus 4 h. The 10 is the start, and minus 4 is the change each hour.
Now a table, with the hours 0, 1, 2, 3, 4 and 5.
To substitute, put a number in place of h. For h equals 0, t is 10 minus 4 times 0, which is 10.
For h equals 1, t is 10 minus 4, which is 6.
For h equals 2, t is 10 minus 8, which is 2. For 3, t is 10 minus 12, which is minus 2.
Then h equals 4 gives minus 6, and 5 gives minus 10.
Each time h goes up by 1, t goes down by 4.
On the graph, hours go along the horizontal axis and temperature goes up the vertical axis.
Each column of the table is one point. Plot them for h equals 0, 1, 2, 3, 4 and 5.
We use whole hours only, so the dots stay separate. That makes the relation discrete.
From each dot, one step right goes 4 down to the next dot.
The drop never changes, so the dots lie on a straight line. That makes it linear.
That minus 4 is in the expression, the table and the graph.
A common mistake is reading minus 4 as plus 4, so the points go up. Minus 4 means each step goes down.
Recap: the expression, the table and the graph show one relation: start at 10, down 4 each hour.
Curriculum
Where this fits
- British Columbia, Grade 8
Mathematics, Patterns and algebra: discrete linear relations (extended to larger numbers, limited to integers)BC8-MA-19
Previous: Graphing y = 2x − 3 with Negative CoordinatesNext: Writing an expression to describe a relationship
The outcomes and strands follow the British Columbia curriculum.
Keep going
 1 min 8 s
7 and 3 More Makes 10
Grade 1 · 1 min 8 s 2 min
Adding Polynomials by Collecting Like Terms
Grade 9 · 2 min 1 min 59 s
Algebra Tiles: Solving 2x + 3 = −5 with Zero Pairs
Grade 8 · 1 min 59 s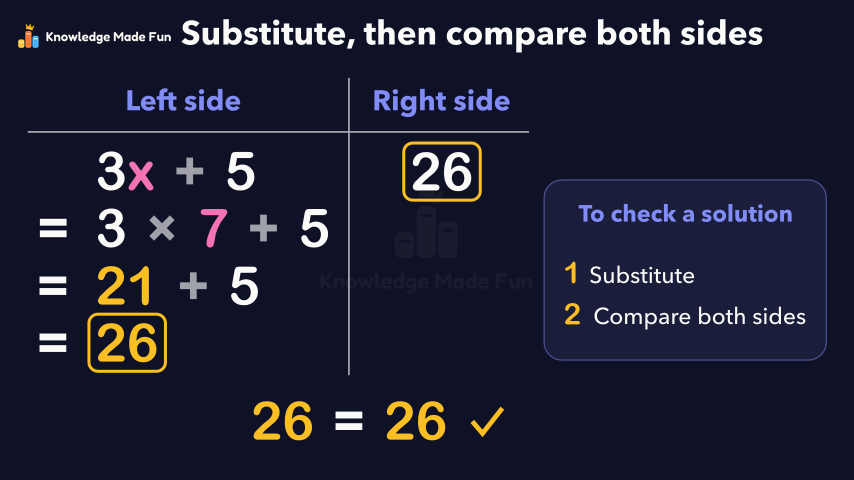 1 min 10 s
Checking a Solution by Substituting
Grade 7 · 1 min 10 s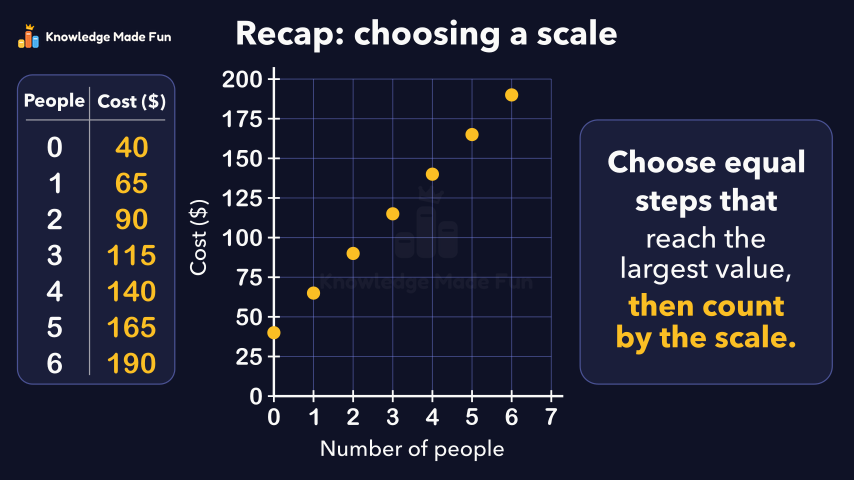 2 min 6 s
Choosing a Scale When the Numbers Are Large
Grade 8 · 2 min 6 s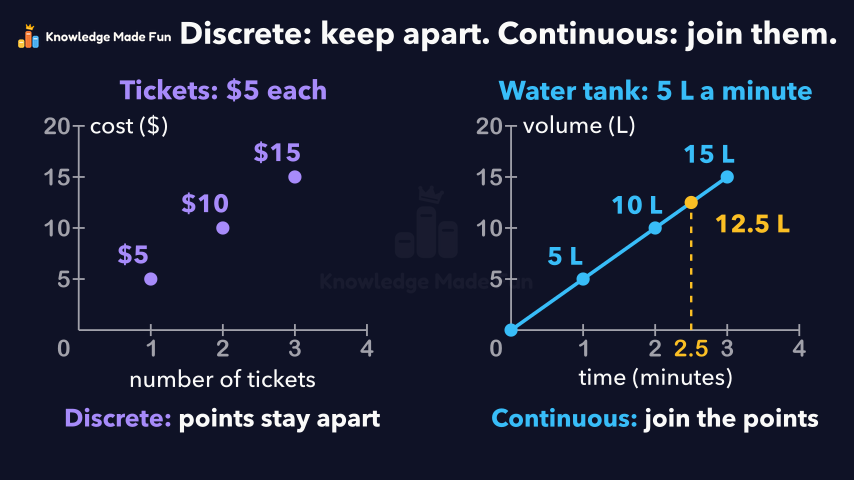 1 min 57 s
Discrete or Continuous: When to Join the Points
Grade 9 · 1 min 57 s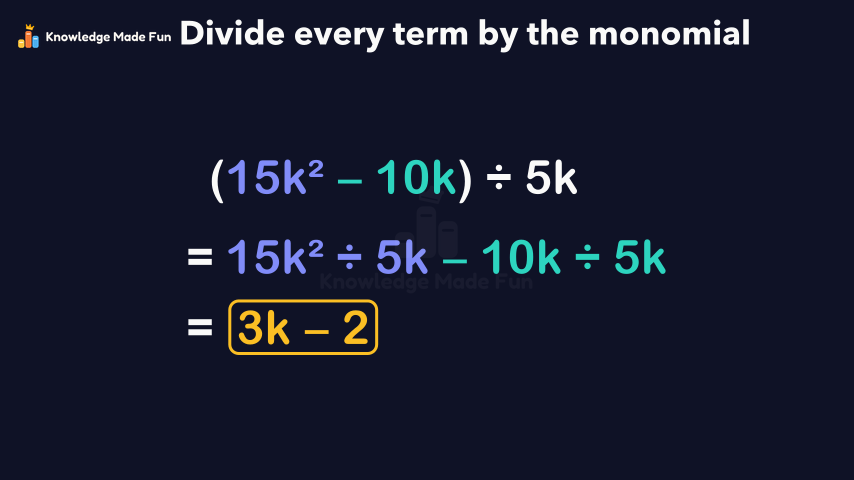 2 min 11 s
Dividing a Polynomial by a Monomial
Grade 9 · 2 min 11 s 1 min 14 s
Equal and Not Equal on a Balance
Grade 1 · 1 min 14 s
- All Grade 8 Mathematics lessons
- Try the graph paper, free for everyone, no account needed.
- Create a free account to watch three lessons a day, no payment and no card.