Lesson · Grade 8 · Mathematics
Graphing y = 2x − 3 with Negative Coordinates
- Grade 8
- Mathematics
- 2 min 9 s
- British Columbia
- BC8-MA-18
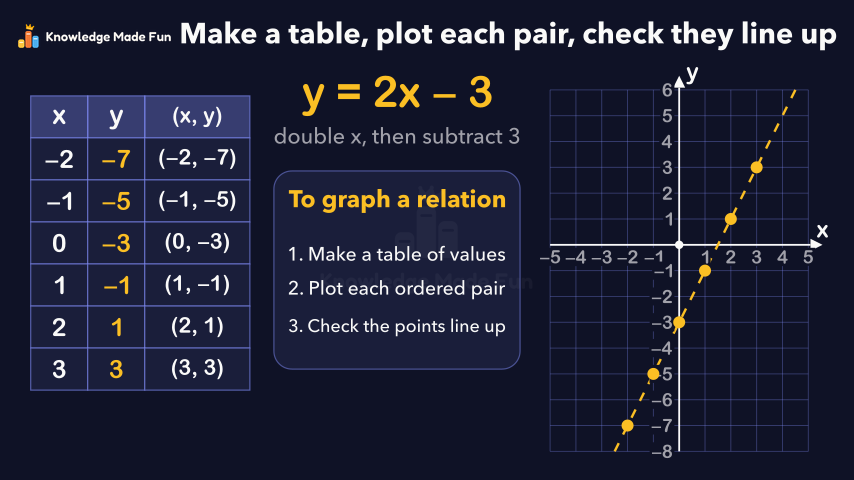
Students build a table of values for y = 2x − 3 from x = −2 to 3, working out each y step by step, then turn each row into an ordered pair and plot it from the origin, where a negative x means go left and a negative y means go down. A dashed line shows that all six points line up, which makes the relation linear, and two common mistakes, dropping the signs to get (1, 5) and swapping x and y to get (−5, −1), are shown as points far off the line.
Concept: Graphing a linear relation with negative coordinates
Anyone can watch two lessons on the website without an account. Signing in is free, no payment and no card, and opens three a day; Plus has no limit.
Loading
In one sentence
The question this lesson answers
How do we graph y equals 2x minus 3, when some of the numbers are negative?
A relation is a rule that links x and y. This one says: double x, then subtract 3.
Transcript
What the lesson says
How do we graph y equals 2x minus 3, when some of the numbers are negative?
A relation is a rule that links x and y. This one says: double x, then subtract 3.
Make a table of values, which pairs each x with its y. Use x from negative 2 to 3.
Put negative 2 in place of x. Double it to get negative 4, then subtract 3 to get negative 7.
Negative 1 doubled is negative 2, and negative 2 minus 3 is negative 5.
0 doubled is 0, and 0 minus 3 is negative 3.
1 doubled is 2, and 2 minus 3 is negative 1.
2 doubled is 4, and 4 minus 3 is 1.
3 doubled is 6, and 6 minus 3 is 3.
Each row is an ordered pair: first the x-coordinate, then the y-coordinate.
The x-axis goes across, and the y-axis goes up and down. They cross at the origin, 0, 0.
Start at the origin. Negative 2 means go left 2, and negative 7 means go down 7.
For negative 1, negative 5, go left 1, then down 5.
The same way, plot 0, negative 3 on the y-axis, then 1, negative 1, then 2, 1, and 3, 3.
A dashed line through them shows that all six points line up, so the relation is linear.
Watch the signs. Dropping them turns negative 1, negative 5 into 1, 5, which is far off the line.
And keep x first. Swapping them gives negative 5, negative 1, which is off the line too.
So, to graph a relation: make a table of values, plot each ordered pair, and check that the points line up.
Curriculum
Where this fits
- British Columbia, Grade 8
Mathematics, Patterns and algebra: discrete linear relations (extended to larger numbers, limited to integers)BC8-MA-18
Previous: Choosing a Scale When the Numbers Are LargeNext: One Relation, Three Ways: Expression, Table and Graph
The outcomes and strands follow the British Columbia curriculum.
Keep going
 1 min 8 s
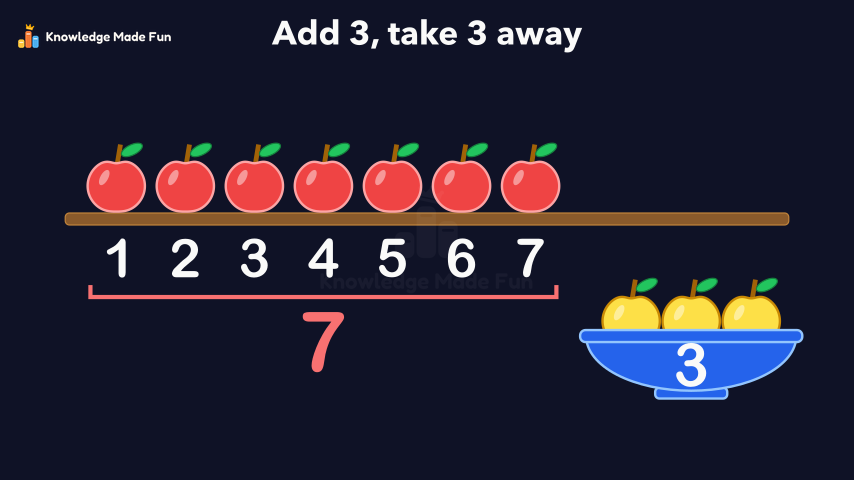
7 and 3 More Makes 10
Grade 1 · 1 min 8 s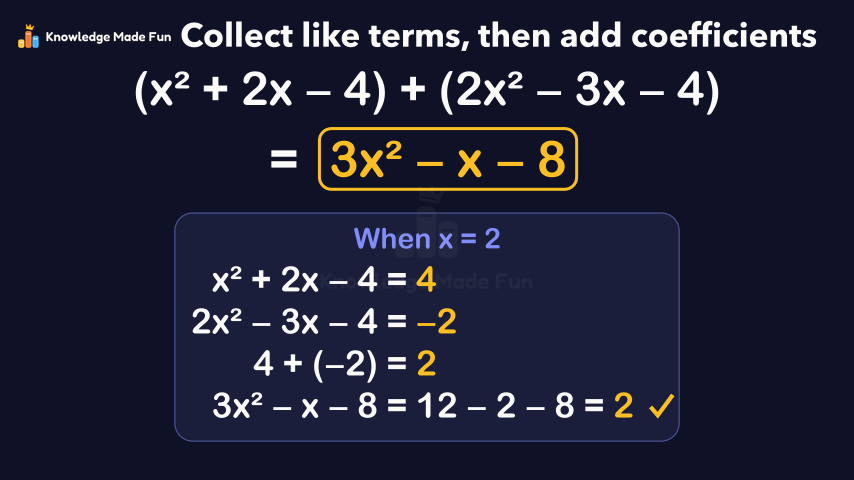 2 min
Adding Polynomials by Collecting Like Terms
Grade 9 · 2 min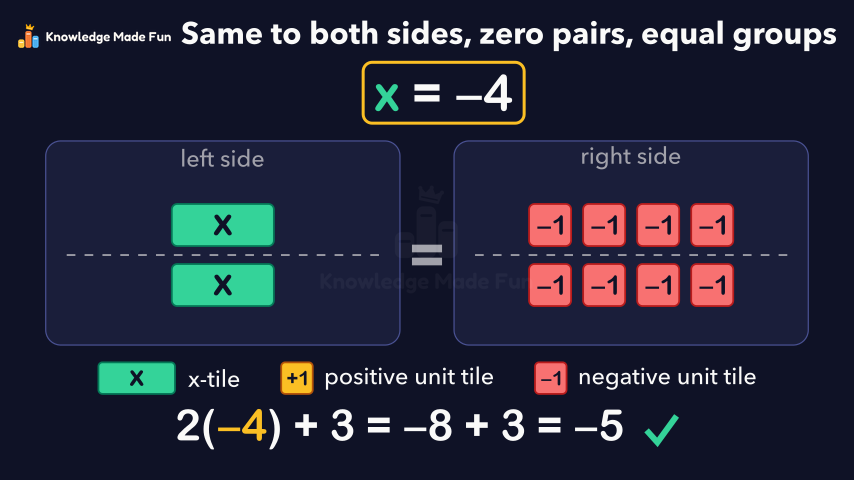 1 min 59 s
Algebra Tiles: Solving 2x + 3 = −5 with Zero Pairs
Grade 8 · 1 min 59 s 1 min 10 s
Checking a Solution by Substituting
Grade 7 · 1 min 10 s 2 min 6 s
Choosing a Scale When the Numbers Are Large
Grade 8 · 2 min 6 s 1 min 57 s
Discrete or Continuous: When to Join the Points
Grade 9 · 1 min 57 s 2 min 11 s
Dividing a Polynomial by a Monomial
Grade 9 · 2 min 11 s 1 min 14 s
Equal and Not Equal on a Balance
Grade 1 · 1 min 14 s
- All Grade 8 Mathematics lessons
- Try the graph paper, free for everyone, no account needed.
- Create a free account to watch three lessons a day, no payment and no card.