Lesson · Grade 9 · Mathematics
Discrete or Continuous: When to Join the Points
- Grade 9
- Mathematics
- 1 min 57 s
- British Columbia
- BC9-MA-15
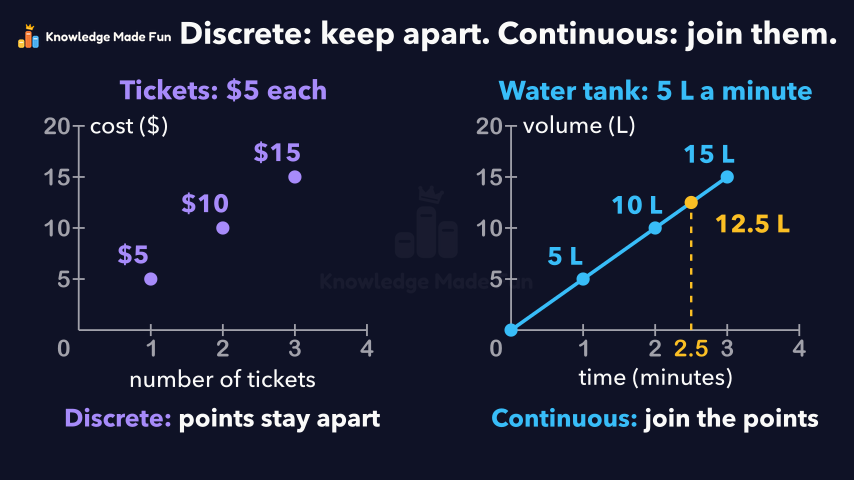
Two graphs side by side compare tickets at $5 each, where 2.5 tickets makes no sense so the points stay apart, with a tank filling at 5 L a minute, where 5 × 2.5 = 12.5 L after 2.5 minutes so the points join into a line. It then shows the common mistake of joining the ticket points and ends with a simple test: if a value in between makes sense, join the points, and if not, keep them apart.
Anyone can watch two lessons on the website without an account. Signing in is free, no payment and no card, and opens three a day; Plus has no limit.
Loading
In one sentence
The question this lesson answers
When you plot points on a graph, should you join them with a line? It depends on the data.
First example: tickets cost 5 dollars each.
Transcript
What the lesson says
When you plot points on a graph, should you join them with a line? It depends on the data.
First example: tickets cost 5 dollars each.
1 ticket costs 5 dollars, 2 tickets cost 10 dollars, and 3 tickets cost 15 dollars.
But can you buy 2.5 tickets? No. You cannot buy half a ticket, so 2.5 tickets makes no sense.
This is called discrete data: only separate values make sense, like whole numbers of tickets. So the points stay apart.
Second example: a tank starts empty and fills with water at 5 litres a minute.
After 1 minute it holds 5 litres, after 2 minutes 10 litres, and after 3 minutes 15 litres.
What about after 2.5 minutes? 5 times 2.5 is 12.5, so the tank holds 12.5 litres.
Time and volume are continuous: any value in a range makes sense, not just whole numbers.
So we join the points with a line, starting from 0 because the tank starts empty.
Reading a value between plotted points, like 12.5 litres at 2.5 minutes, is called interpolation.
A common mistake is joining the dots when only whole numbers make sense.
This line says 2.5 tickets cost 12 dollars and 50 cents. That makes no sense.
So ask: does a value in between make sense? If it does, join the points. If not, keep them apart.
Discrete data keeps its points apart, and continuous data joins them into a line.
Curriculum
Where this fits
- British Columbia, Grade 9
Mathematics, Patterns and algebra: two-variable linear relations, using graphing, interpolation, and extrapolationBC9-MA-15
Previous: Dividing a Polynomial by a MonomialNext: Graphing y = ½x + 2 and Reading Between the Points
The outcomes and strands follow the British Columbia curriculum.
Keep going
 1 min 8 s
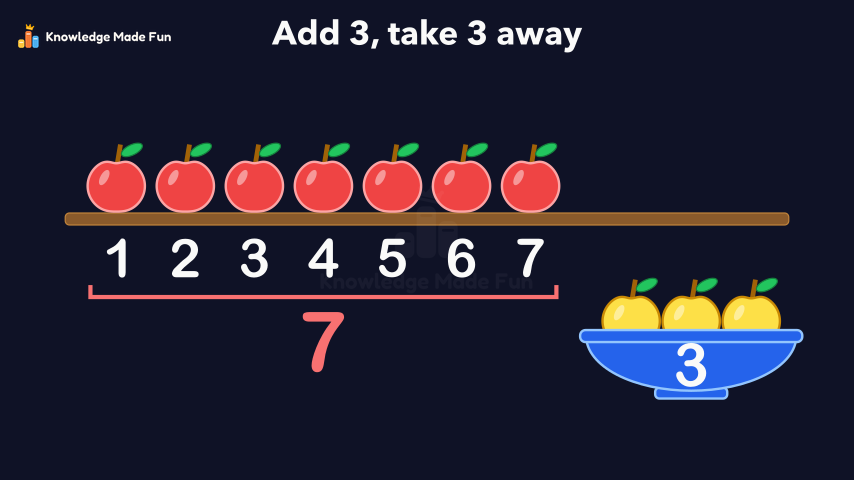
7 and 3 More Makes 10
Grade 1 · 1 min 8 s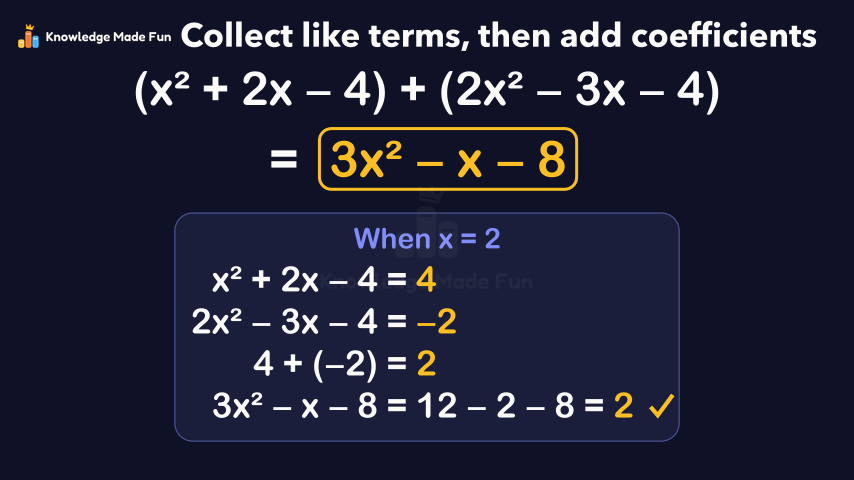 2 min
Adding Polynomials by Collecting Like Terms
Grade 9 · 2 min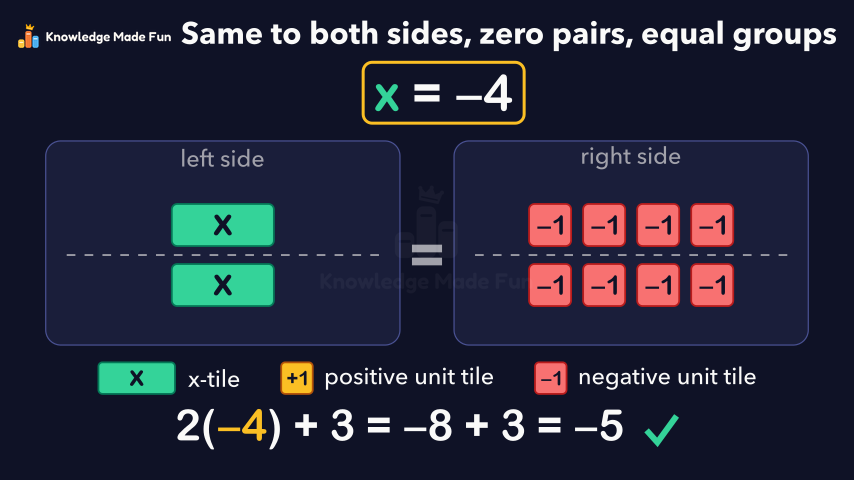 1 min 59 s
Algebra Tiles: Solving 2x + 3 = −5 with Zero Pairs
Grade 8 · 1 min 59 s 1 min 10 s
Checking a Solution by Substituting
Grade 7 · 1 min 10 s 2 min 6 s
Choosing a Scale When the Numbers Are Large
Grade 8 · 2 min 6 s 2 min 11 s
Dividing a Polynomial by a Monomial
Grade 9 · 2 min 11 s 1 min 14 s
Equal and Not Equal on a Balance
Grade 1 · 1 min 14 s 1 min 10 s
Equal and Not Equal on a Balance
Grade 2 · 1 min 10 s
- All Grade 9 Mathematics lessons
- Try the graph paper, free for everyone, no account needed.
- Create a free account to watch three lessons a day, no payment and no card.