Lesson · Grade 9 · Mathematics
Graphing y = ½x + 2 and Reading Between the Points
- Grade 9
- Mathematics
- 2 min 2 s
- British Columbia
- BC9-MA-16
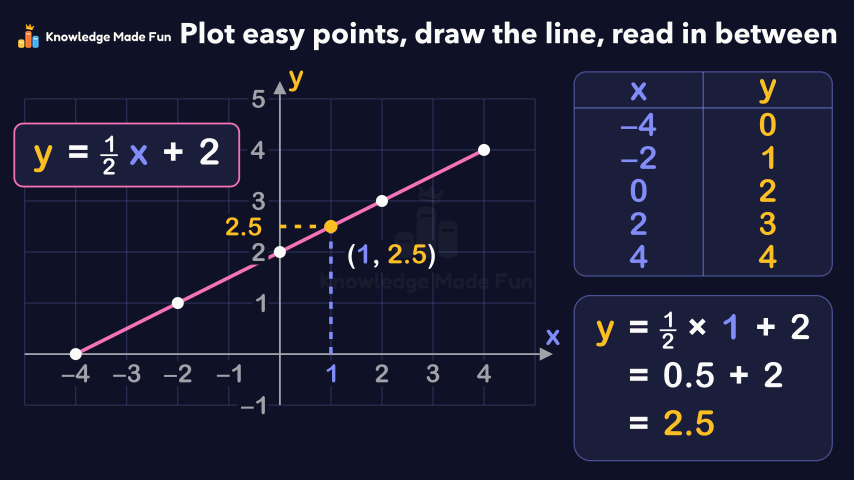
Using even x-values, a table of values gives five whole-number points for y = ½x + 2, which are plotted and joined with one straight line rather than left as dots. The line is then read at x = 1 to get y = 2.5 (interpolation), and the rule checks it: ½ × 1 + 2 = 2.5.
Concept: Graphing a linear relation with fraction and decimal values
Anyone can watch two lessons on the website without an account. Signing in is free, no payment and no card, and opens three a day; Plus has no limit.
Loading
In one sentence
The question this lesson answers
Let us graph y equals one half x plus 2. It is a linear relation: a rule linking x and y whose graph is a straight line.
Make a table of values: x-values in one column, their y-values in the other.
Transcript
What the lesson says
Let us graph y equals one half x plus 2. It is a linear relation: a rule linking x and y whose graph is a straight line.
Make a table of values: x-values in one column, their y-values in the other.
Half of an even number is an integer, so pick even x-values: negative 4, negative 2, 0, 2 and 4.
Substitute each x-value in place of x. For negative 4, half of negative 4 is negative 2, plus 2 is 0.
For negative 2, half of negative 2 is negative 1, plus 2 is 1.
For 0, half of 0 is 0, plus 2 is 2.
For 2, half of 2 is 1, plus 2 is 3.
For 4, half of 4 is 2, plus 2 is 4.
Each row is an ordered pair, x first, then y. From the origin, where the axes cross, go across to 2, then up to 3.
Plot the other rows the same way: negative 4, 0; negative 2, 1; 0, 2; and 4, 4.
A common mistake is to plot the points and stop there.
Every x-value in between has a y-value too, so join the points with one straight line.
Reading values between plotted points is called interpolation. Find y when x is 1.
Go up from 1 to the line, then across to the y-axis. It lands halfway between 2 and 3, at 2.5.
Check with the rule: half of 1 is 0.5, and 0.5 plus 2 is 2.5. It matches.
Plot easy points, draw a straight line through them, and read values in between.
Curriculum
Where this fits
- British Columbia, Grade 9
Mathematics, Patterns and algebra: two-variable linear relations, using graphing, interpolation, and extrapolationBC9-MA-16
Previous: Discrete or Continuous: When to Join the PointsNext: Horizontal and vertical lines: y = 3 and x = −2
The outcomes and strands follow the British Columbia curriculum.
Keep going
 1 min 8 s
7 and 3 More Makes 10
Grade 1 · 1 min 8 s 2 min
Adding Polynomials by Collecting Like Terms
Grade 9 · 2 min 1 min 59 s
Algebra Tiles: Solving 2x + 3 = −5 with Zero Pairs
Grade 8 · 1 min 59 s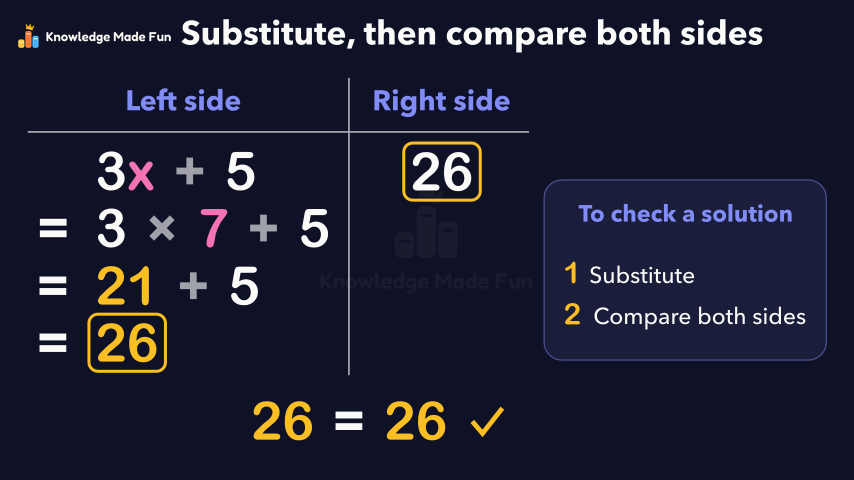 1 min 10 s
Checking a Solution by Substituting
Grade 7 · 1 min 10 s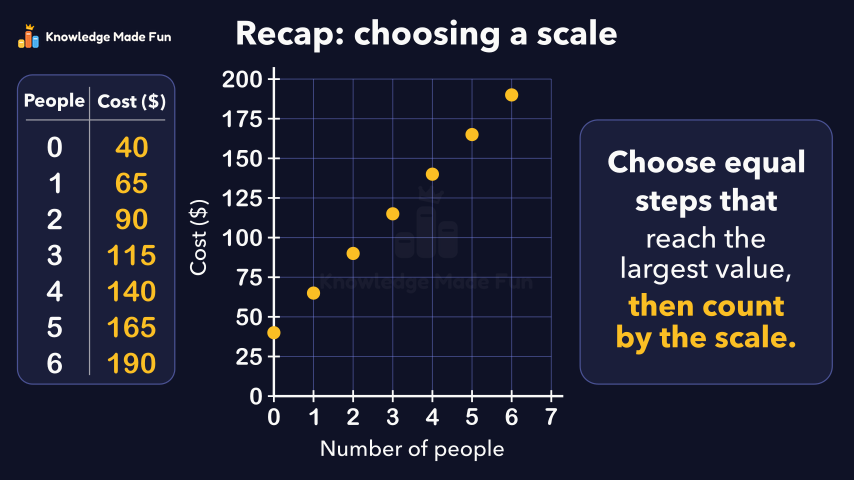 2 min 6 s
Choosing a Scale When the Numbers Are Large
Grade 8 · 2 min 6 s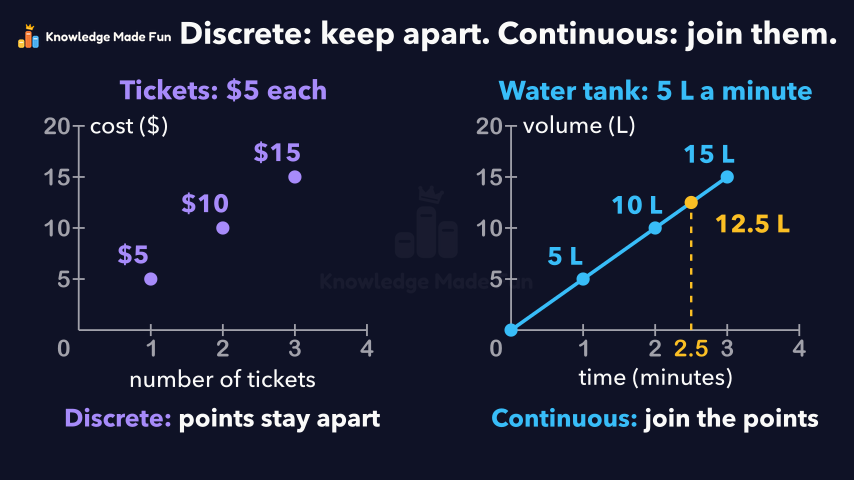 1 min 57 s
Discrete or Continuous: When to Join the Points
Grade 9 · 1 min 57 s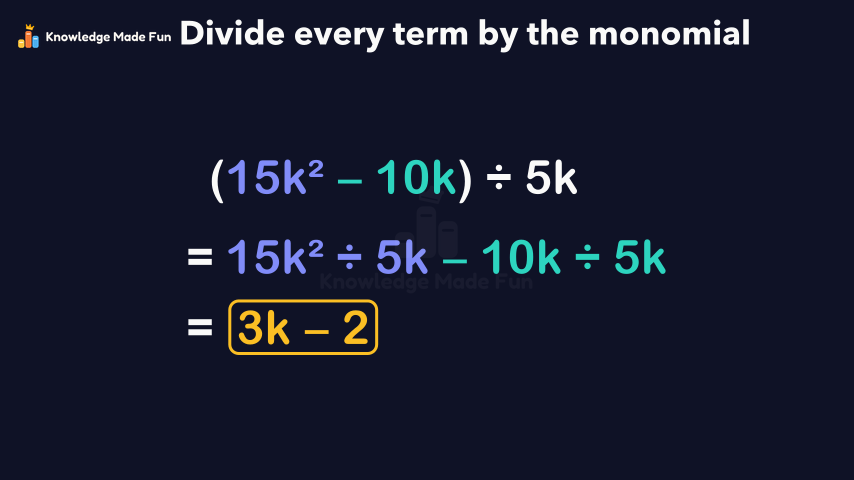 2 min 11 s
Dividing a Polynomial by a Monomial
Grade 9 · 2 min 11 s 1 min 14 s
Equal and Not Equal on a Balance
Grade 1 · 1 min 14 s
- All Grade 9 Mathematics lessons
- Try the graph paper, free for everyone, no account needed.
- Create a free account to watch three lessons a day, no payment and no card.