Lesson · Grade 11 · Foundations of Mathematics
The Normal Distribution and Z-Scores
- Grade 11
- Foundations of Mathematics
- 2 min 33 s
- British Columbia
- BC11-MA-33
A bell curve of heights with mean 170 cm and standard deviation 8 cm builds up the 68%, 95% and 99.7% ranges, then works out the z-score of 186 cm, (186 − 170) ÷ 8 = 2, and shows that this is taller than about 97.5% of people. The same curve, read in z-scores, then shows that 78 on a test with mean 70 and SD 4 (z = 2) beats 85 on a test with mean 75 and SD 10 (z = 1), warning against comparing raw marks.
Anyone can watch two lessons on the website without an account. Signing in is free, no payment and no card, and opens three a day; Plus has no limit.
Loading
In one sentence
The question this lesson answers
Heights in a large group average 170 centimetres. How unusual is 186 centimetres?
Heights like these roughly follow a normal distribution: a symmetric bell curve.
Transcript
What the lesson says
Heights in a large group average 170 centimetres. How unusual is 186 centimetres?
Heights like these roughly follow a normal distribution: a symmetric bell curve.
The peak is at the mean, 170 centimetres.
The standard deviation, or SD, measures how spread out the heights are. Here it is 8 centimetres.
About 68 percent of heights are within 1 standard deviation of the mean, between 162 and 178.
About 95 percent are within 2 standard deviations, between 154 and 186.
And about 99.7 percent are within 3, between 146 and 194.
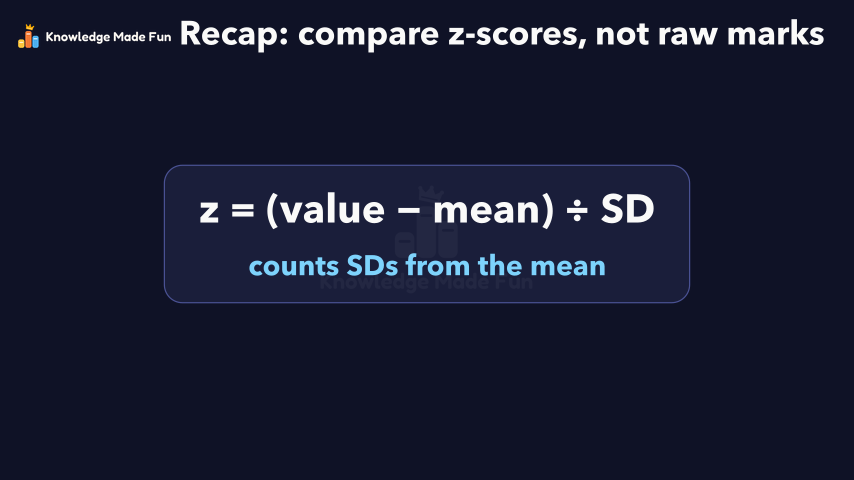
A z-score counts how many standard deviations a value is above or below the mean.
For 186, subtract the mean: 186 minus 170 is 16. Then divide by the SD: 16 divided by 8 is 2.
Check: 170 plus 2 times 8 is 186.
The other 5 percent is outside 2 SDs, half at each end, so about 2.5 percent are taller than 186.
So 186 centimetres is taller than about 97.5 percent of people.
Now use z-scores to compare: is 78 on test A better than 85 on test B?
Test A has mean 70 and SD 4. 78 minus 70 is 8, and 8 divided by 4 is 2.
Test B has mean 75 and SD 10. 85 minus 75 is 10, and 10 divided by 10 is 1.
78 is 2 SDs above its mean, but 85 is only 1, so 78 is the better result.
A common mistake is comparing raw marks: 85 is higher than 78, but the tests have different means and SDs.
Recap: a z-score counts SDs from the mean, so compare z-scores, not raw marks.
Curriculum
Where this fits
- British Columbia, Grade 11
Foundations of Mathematics 11, Statistics: applications of statisticsBC11-MA-33
Previous: Standard deviation: how spread out the data areNext: What "plus or minus 3%" really means in a poll
The outcomes and strands follow the British Columbia curriculum.
Keep going
 2 min 20 s
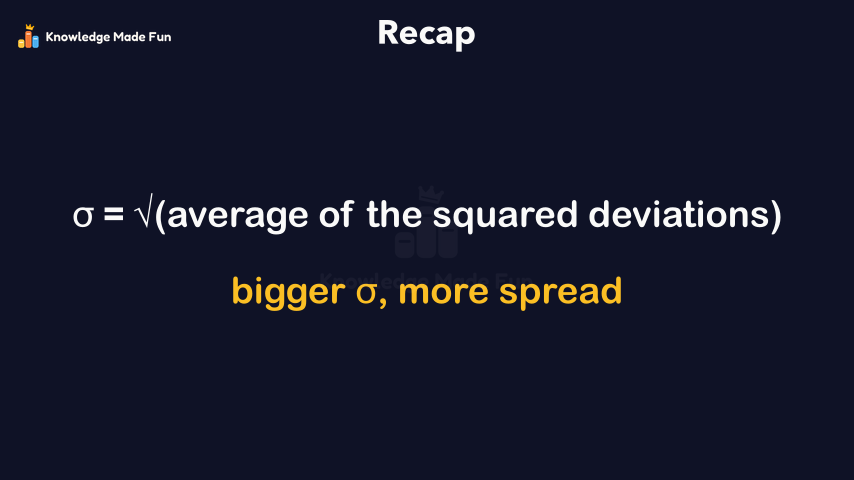
Standard deviation: how spread out the data are
Grade 11 · 2 min 20 s 2 min 19 s
What "plus or minus 3%" really means in a poll
Grade 11 · 2 min 19 s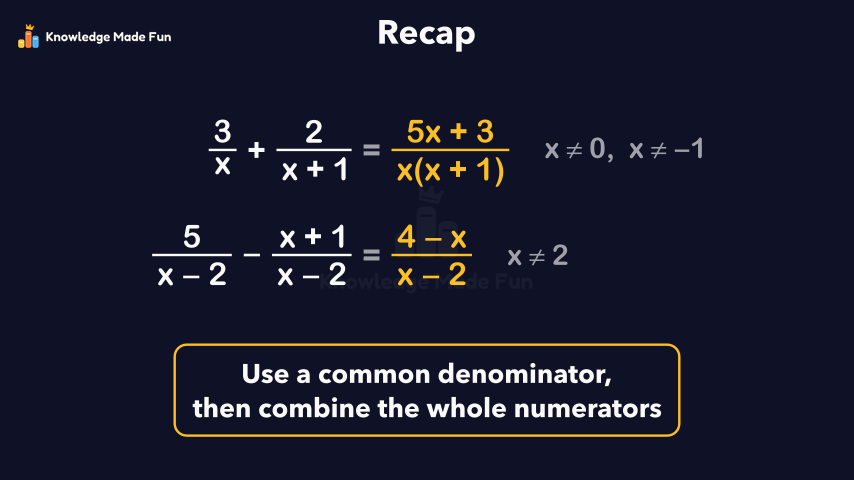 2 min 11 s
Adding and Subtracting Rational Expressions
Grade 11 · 2 min 11 s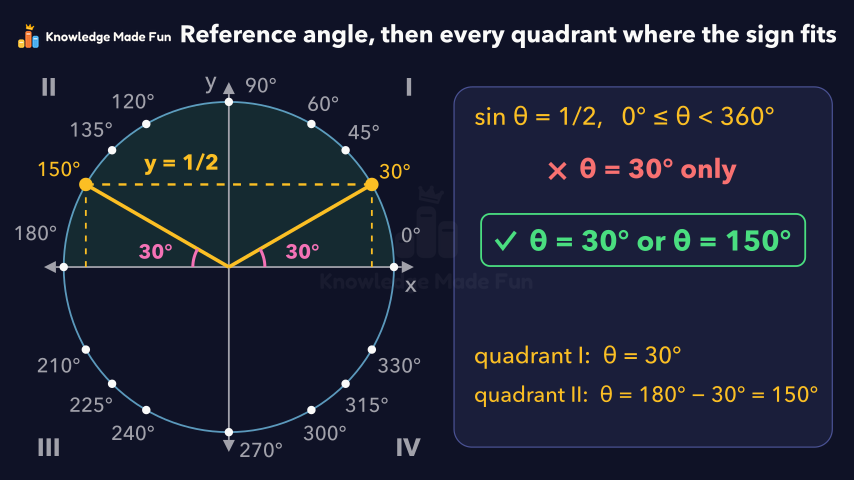 2 min 3 s
Angles in Standard Position and Reference Angles
Grade 11 · 2 min 3 s 1 min 58 s
Angles made by parallel lines and a transversal
Grade 11 · 1 min 58 s 2 min 12 s
Angles of Elevation and Depression: Measuring What You Cannot Reach
Grade 10 · 2 min 12 s 1 min 58 s
Choosing the best average: mean, median or mode
Grade 8 · 1 min 58 s 2 min 24 s
Completing the Square: From Standard Form to Vertex Form
Grade 11 · 2 min 24 s
- All Grade 11 Foundations of Mathematics lessons
- Create a free account to watch three lessons a day, no payment and no card.