Lesson · Grade 11 · Foundations of Mathematics
Standard deviation: how spread out the data are
- Grade 11
- Foundations of Mathematics
- 2 min 20 s
- British Columbia
- BC11-MA-32
Eight quiz scores (2, 4, 4, 4, 5, 5, 7, 9, mean 5) are shown as dots above a mean line, with each deviation from the mean drawn as a bar; the deviations are squared (total 32), averaged into the variance (32 ÷ 8 = 4) and square rooted to give σ = 2. Then a wider group with the same mean gives σ = 3, and adding 1 to every score raises the mean to 6 but leaves σ at 2; the video ends by showing that a calculator does it in one step, that a sample divides by n − 1 (about 2.14), and with a one-line recap.
Anyone can watch two lessons on the website without an account. Signing in is free, no payment and no card, and opens three a day; Plus has no limit.
Loading
In one sentence
The question this lesson answers
Group A scored 2, 4, 4, 4, 5, 5, 7 and 9 on a quiz out of 10. How spread out are they?
They add up to 40, so the mean is 40 divided by 8, which is 5.
Transcript
What the lesson says
Group A scored 2, 4, 4, 4, 5, 5, 7 and 9 on a quiz out of 10. How spread out are they?
They add up to 40, so the mean is 40 divided by 8, which is 5.
Standard deviation measures spread: roughly, how far a typical score is from the mean.
Step 1: a deviation is how far a score is above or below the mean. They are minus 3, minus 1, minus 1, minus 1, 0, 0, 2 and 4.
Step 2: the deviations add up to 0, so square each one: 9, 1, 1, 1, 0, 0, 4 and 16.
Step 3: the squares add up to 32, and 32 divided by 8 is 4. This average is called the variance.
Step 4: take the square root to get back to marks. The square root of 4 is 2.
So the standard deviation, sigma, is 2: a typical score is about 2 marks from the mean.
Group B scored 0, 2, 4, 4, 6, 6, 8 and 10. Its mean is also 5.
Its deviations are bigger: the squares add up to 72, 72 divided by 8 is 9, and the square root of 9 is 3.
A common mistake is thinking a bigger mean means more spread. Add 1 to every score in group A: the mean rises to 6, but the deviations stay the same, so sigma is still 2.
A calculator or spreadsheet does all this in one step. For a whole group, it divides by n, the number of values, here 8.
For a sample of a bigger group, it divides by n minus 1, here 7, giving about 2.14.
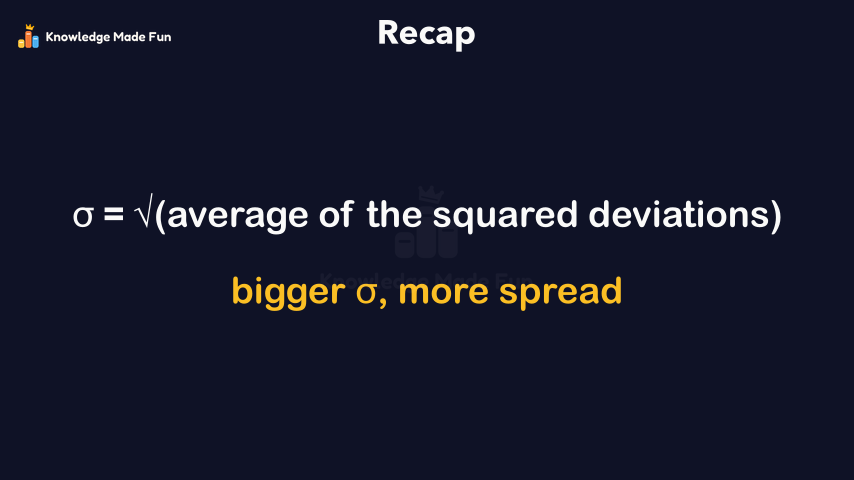
Recap: the standard deviation is the square root of the average of the squared deviations, and a bigger one means more spread.
Curriculum
Where this fits
- British Columbia, Grade 11
Foundations of Mathematics 11, Statistics: applications of statisticsBC11-MA-32
- British Columbia, Grade 12
Statistics 12, Describing data: use of summary statistics to describe variationBC12-MA-199
This lesson is also listed in Grade 12.
The outcomes and strands follow the British Columbia curriculum.
Keep going
 2 min 33 s
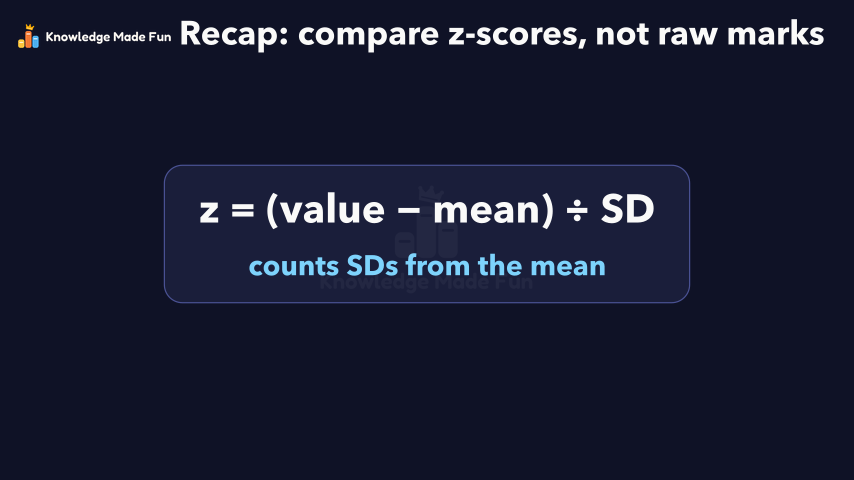
The Normal Distribution and Z-Scores
Grade 11 · 2 min 33 s 2 min 19 s
What "plus or minus 3%" really means in a poll
Grade 11 · 2 min 19 s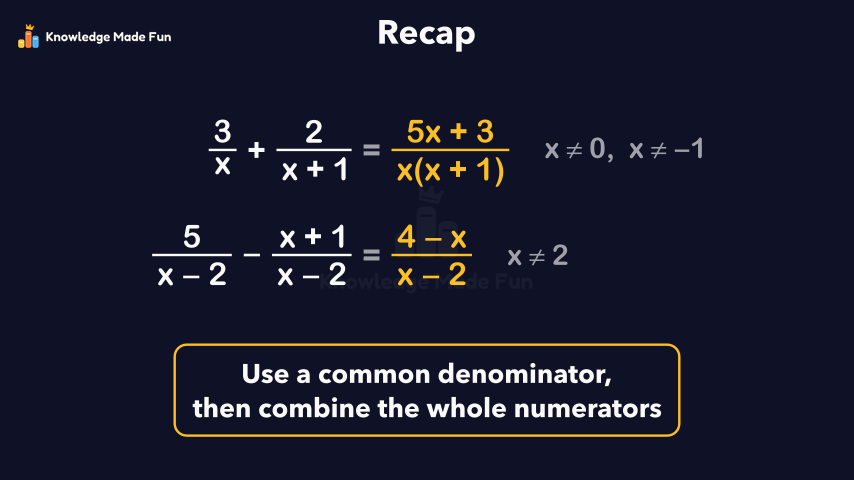 2 min 11 s
Adding and Subtracting Rational Expressions
Grade 11 · 2 min 11 s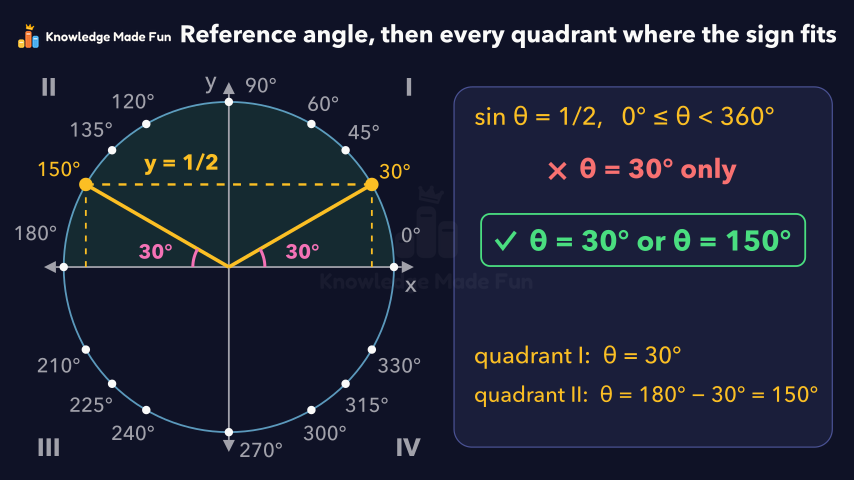 2 min 3 s
Angles in Standard Position and Reference Angles
Grade 11 · 2 min 3 s 1 min 58 s
Angles made by parallel lines and a transversal
Grade 11 · 1 min 58 s 2 min 12 s
Angles of Elevation and Depression: Measuring What You Cannot Reach
Grade 10 · 2 min 12 s 1 min 58 s
Choosing the best average: mean, median or mode
Grade 8 · 1 min 58 s 2 min 24 s
Completing the Square: From Standard Form to Vertex Form
Grade 11 · 2 min 24 s
- All Grade 11 Foundations of Mathematics lessons
- Create a free account to watch three lessons a day, no payment and no card.