Lesson · Grade 11 · Foundations of Mathematics
What "plus or minus 3%" really means in a poll
- Grade 11
- Foundations of Mathematics
- 2 min 19 s
- British Columbia
- BC11-MA-34
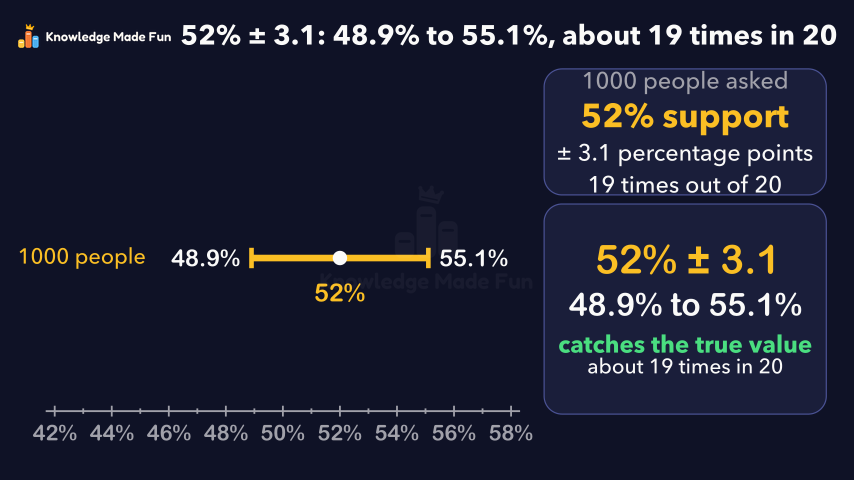
A poll of 1000 people finds 52% support, accurate to within 3.1 percentage points, 19 times out of 20. That makes the confidence interval 48.9% to 55.1%, so 52% is not a sure majority. Twenty imaginary polls show that about 19 in 20 intervals include the true value, so the 95% describes the method rather than a chance for this one poll, and a sample of 4000 people narrows the interval to 50.5% to 53.5%.
Concept: Confidence intervals: what plus or minus 3% means in a poll
Anyone can watch two lessons on the website without an account. Signing in is free, no payment and no card, and opens three a day; Plus has no limit.
Loading
In one sentence
The question this lesson answers
A poll of 1000 people finds 52% support a new plan, accurate to within 3.1 percentage points, 19 times out of 20.
So do most people support it?
Transcript
What the lesson says
A poll of 1000 people finds 52% support a new plan, accurate to within 3.1 percentage points, 19 times out of 20.
So do most people support it?
The 1000 people are a random sample of the population, everyone the poll is about. Their 52% is an estimate of the true value: the percentage for everyone.
The 3.1 is the margin of error, in percentage points: we take 3.1 away from 52 and add it to 52.
52 minus 3.1 is 48.9, and 52 plus 3.1 is 55.1. This range is called the confidence interval.
Part of the interval is below 50%, so the true value could be under half. 52% is not a sure majority.
19 times out of 20 is called the confidence level. 19 divided by 20 is 0.95, or 95%.
Now imagine 20 polls like ours, each of 1000 random people, and suppose the true value is 49.5%, under half.
19 intervals cross the line and catch the true value, ours included. One misses: the 1 time in 20.
With one real poll, you cannot see the true value, so you cannot tell if yours is a catch or a miss.
So 95% is not the chance this one poll is right. It means the method catches the true value in about 19 of every 20 polls.
Bigger samples give narrower intervals. With 4000 people, the margin of error is about 1.5 points, so 52% gives 50.5% to 53.5%, all above half.
So 52% plus or minus 3.1 means 48.9% to 55.1%, by a method that catches the true value about 19 times in 20.
Curriculum
Where this fits
- British Columbia, Grade 11
Foundations of Mathematics 11, Statistics: applications of statisticsBC11-MA-34
Previous: The Normal Distribution and Z-ScoresNext: Choosing the best average: mean, median or mode
The outcomes and strands follow the British Columbia curriculum.
Keep going
 2 min 20 s
Standard deviation: how spread out the data are
Grade 11 · 2 min 20 s 2 min 33 s
The Normal Distribution and Z-Scores
Grade 11 · 2 min 33 s 2 min 11 s
Adding and Subtracting Rational Expressions
Grade 11 · 2 min 11 s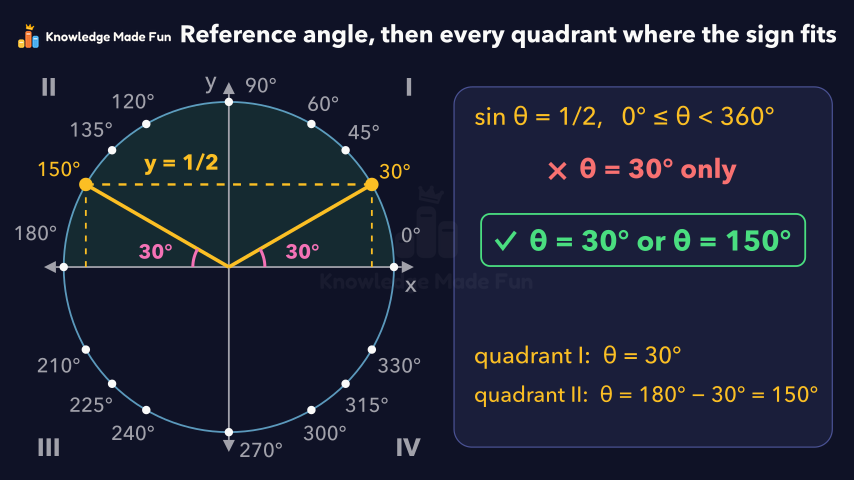 2 min 3 s
Angles in Standard Position and Reference Angles
Grade 11 · 2 min 3 s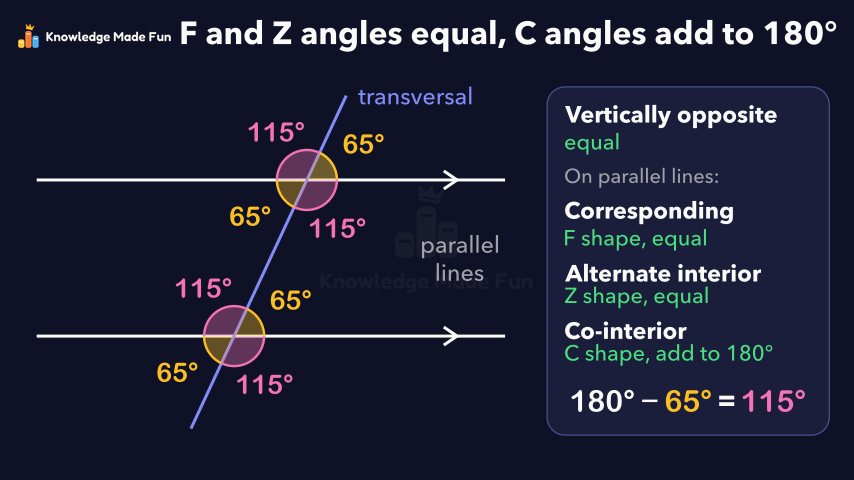 1 min 58 s
Angles made by parallel lines and a transversal
Grade 11 · 1 min 58 s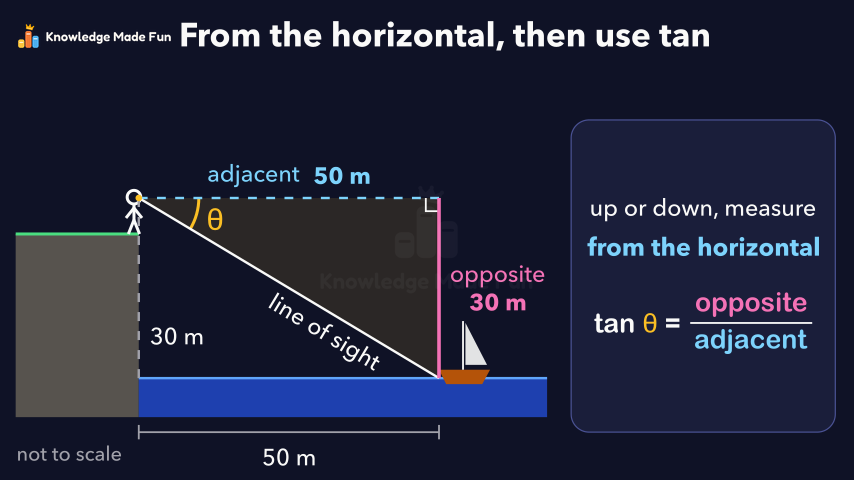 2 min 12 s
Angles of Elevation and Depression: Measuring What You Cannot Reach
Grade 10 · 2 min 12 s 1 min 58 s
Choosing the best average: mean, median or mode
Grade 8 · 1 min 58 s 2 min 24 s
Completing the Square: From Standard Form to Vertex Form
Grade 11 · 2 min 24 s
- All Grade 11 Foundations of Mathematics lessons
- Create a free account to watch three lessons a day, no payment and no card.