Lesson · Grade 7 · Mathematics
Graphing a Linear Relation from Its Table
- Grade 7
- Mathematics
- 1 min 14 s
- British Columbia
- BC7-MA-37
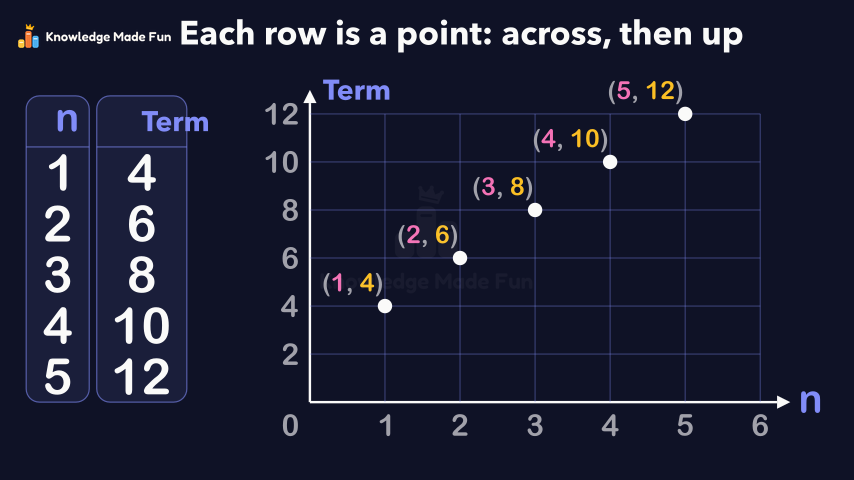
Starting from a table of values (n = 1 to 5, terms 4, 6, 8, 10, 12), the video draws two axes and plots each row as a point by going across for n and up for the term, building each ordered pair from its row of the table. The points line up in a straight line that goes across 1 and up 2 each time, matching the +2 down the table, so the relation is linear; because n is a whole number the points are not joined.
Anyone can watch two lessons on the website without an account. Signing in is free, no payment and no card, and opens three a day; Plus has no limit.
Loading
In one sentence
The question this lesson answers
This table gives the term for each term number, n.
How can we show this table on a graph?
Transcript
What the lesson says
This table gives the term for each term number, n.
How can we show this table on a graph?
Draw two axes, with n going across and the term going up.
The terms reach 12, so count up the side by 2s.
Start with the first row, where n is 1 and the term is 4.
From zero, go across to 1.
Then go up to 4.
Mark a point there to show the pair 1 and 4.
Plot the other rows the same way, across and then up.
The points lie on a straight line, so the relation is linear.
Each step across 1 goes up 2, just like the table.
There is no term number 1 and a half, so we do not join the points.
To graph a table, plot each row as a point: across for n, then up for the term.
Curriculum
Where this fits
- British Columbia, Grade 7
Mathematics, Patterns and algebra: discrete linear relations, using expressions, tables, and graphsBC7-MA-37
Previous: Evaluating an Expression by SubstitutionNext: Reading the rule from a graph
The outcomes and strands follow the British Columbia curriculum.
Keep going
 1 min 8 s
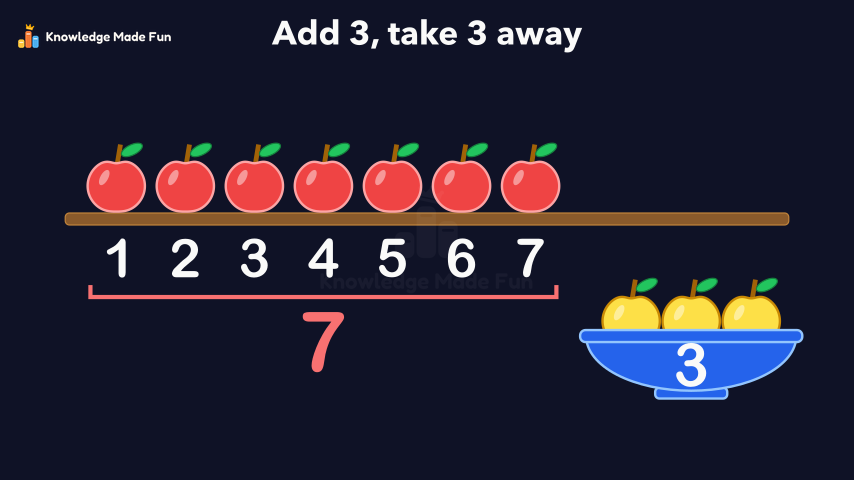
7 and 3 More Makes 10
Grade 1 · 1 min 8 s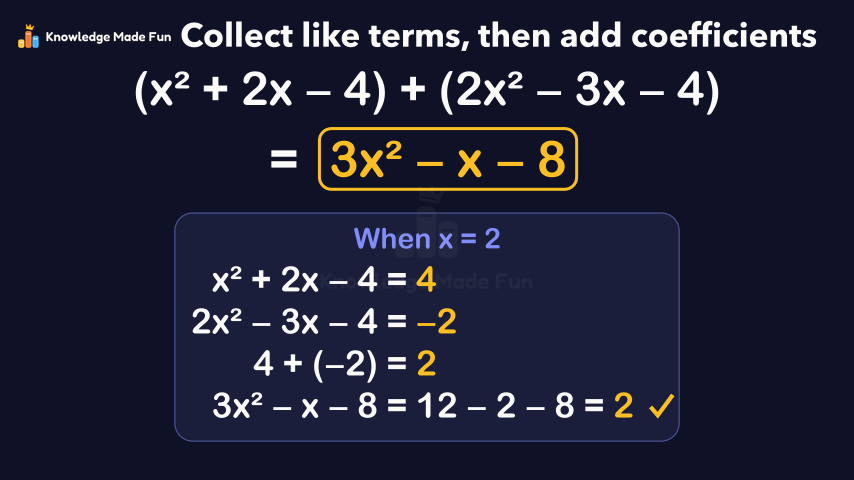 2 min
Adding Polynomials by Collecting Like Terms
Grade 9 · 2 min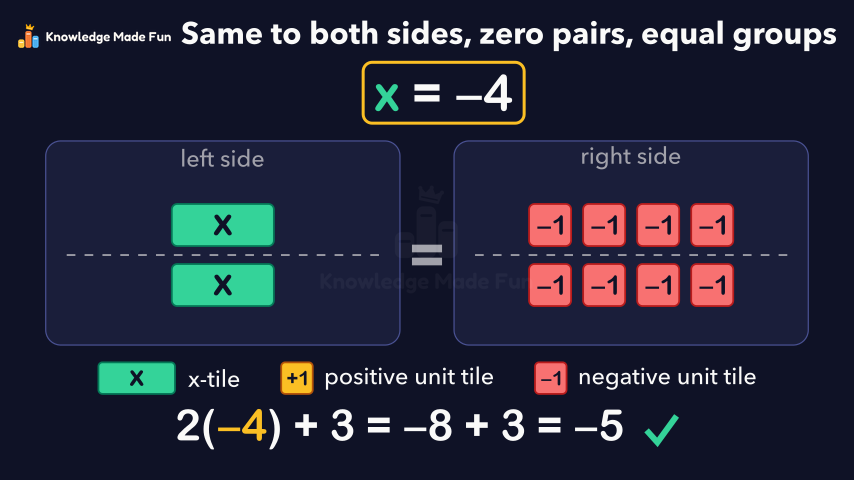 1 min 59 s
Algebra Tiles: Solving 2x + 3 = −5 with Zero Pairs
Grade 8 · 1 min 59 s 1 min 10 s
Checking a Solution by Substituting
Grade 7 · 1 min 10 s 2 min 6 s
Choosing a Scale When the Numbers Are Large
Grade 8 · 2 min 6 s 1 min 57 s
Discrete or Continuous: When to Join the Points
Grade 9 · 1 min 57 s 2 min 11 s
Dividing a Polynomial by a Monomial
Grade 9 · 2 min 11 s 1 min 14 s
Equal and Not Equal on a Balance
Grade 1 · 1 min 14 s
- All Grade 7 Mathematics lessons
- Teachers: the maths worksheets for Grade 7 are in the dashboard, each with a worked example and a proven answer key.
- Try the graph paper, free for everyone, no account needed.
- Create a free account to watch three lessons a day, no payment and no card.